
Page 148 - How To Implement Lean Manufacturing
P. 148
126 Cha pte r Se v e n
Zeta Cell, 5 Stations
50
Takt time, 39 secs
40
Design cycle time 35 secs
Cycle time, secs 20
30
10
0
1 2 3 4 5
Station
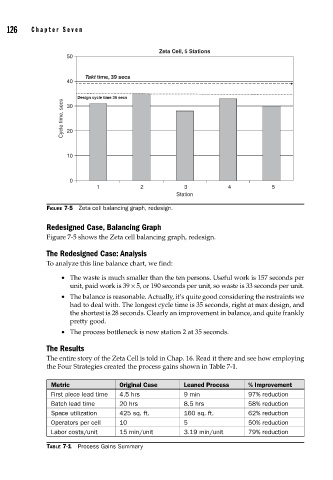
FIGURE 7-5 Zeta cell balancing graph, redesign.
Redesigned Case, Balancing Graph
Figure 7-5 shows the Zeta cell balancing graph, redesign.
The Redesigned Case: Analysis
To analyze this line balance chart, we find:
• The waste is much smaller than the ten persons. Useful work is 157 seconds per
unit, paid work is 39 × 5, or 190 seconds per unit, so waste is 33 seconds per unit.
• The balance is reasonable. Actually, it’s quite good considering the restraints we
had to deal with. The longest cycle time is 35 seconds, right at max design, and
the shortest is 28 seconds. Clearly an improvement in balance, and quite frankly
pretty good.
• The process bottleneck is now station 2 at 35 seconds.
The Results
The entire story of the Zeta Cell is told in Chap. 16. Read it there and see how employing
the Four Strategies created the process gains shown in Table 7-1.
Metric Original Case Leaned Process % Improvement
First piece lead time 4.5 hrs 9 min 97% reduction
Batch lead time 20 hrs 8.5 hrs 58% reduction
Space utilization 425 sq. ft. 160 sq. ft. 62% reduction
Operators per cell 10 5 50% reduction
Labor costs/unit 15 min/unit 3.19 min/unit 79% reduction
TABLE 7-1 Process Gains Summary