
Page 147 - How To Implement Lean Manufacturing
P. 147
How to Do Lean—The Four Strategies to Becoming Lean 125
The Present Case Analysis
Let’s analyze the chart for the three simple reviews available from this type of a graph,
specifically.
This line balance chart shows graphically the time wasted, which is the distance from
the top of the bar graph for any station to the takt line—that is, if the production could be
made at takt rate. You will find in Chap. 16 that this cell is performing so poorly it takes
over two shifts, rather than the design of one shift, to produce the volume. So even
though this graph shows clearly there is a huge time waste, it also grossly understates
the waste. The actual wasted work time is much worse than this chart shows, and this
chart is very bad! (The actual paid time was over 78 seconds per unit × 10 operators or
780 seconds, yielding 623 seconds per unit of waste; over 80 percent wasted labor time.)
The balance is poor since the tallest bar is 22 seconds and the shortest is 10. This is
not good balance; the cycle times should be very similar. The bottleneck, the longest
cycle time, occurs twice. Both stations 1 and 6 are 22 seconds.
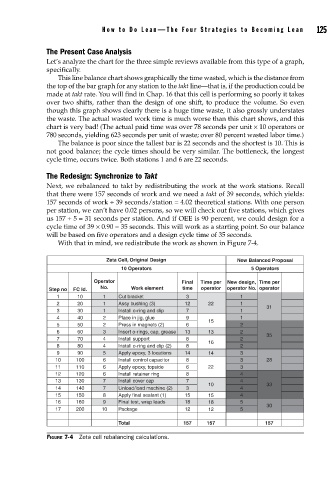
The Redesign: Synchronize to Takt
Next, we rebalanced to takt by redistributing the work at the work stations. Recall
that there were 157 seconds of work and we need a takt of 39 seconds, which yields:
157 seconds of work ÷ 39 seconds/station = 4.02 theoretical stations. With one person
per station, we can’t have 0.02 persons, so we will check out five stations, which gives
us 157 ÷ 5 = 31 seconds per station. And if OEE is 90 percent, we could design for a
cycle time of 39 × 0.90 = 35 seconds. This will work as a starting point. So our balance
will be based on five operators and a design cycle time of 35 seconds.
With that in mind, we redistribute the work as shown in Figure 7-4.
Zeta Cell, Original Design New Balanced Proposal
10 Operators 5 Operators
Operator Final Time per New design, Time per
No. Work element time operator operator No. operator
Step no FC Id.
1 10 1 Cut bracket 3 1
2 20 1 Assy bushing (3) 12 22 1
31
3 30 1 Install o-ring and clip 7 1
4 40 2 Place in jig, glue 9 1
15
5 50 2 Press in magnets (2) 6 2
6 60 3 Insert o-rings, cap, grease 13 13 2
35
7 70 4 Install support 8 2
16
8 80 4 Install o-ring and clip (2) 8 2
9 90 5 Apply epoxy, 3 locations 14 14 3
10 100 6 Install control capacitor 8 3 28
11 110 6 Apply epoxy, topside 6 22 3
12 120 6 Install retainer ring 8 4
13 130 7 Install cover cap 7 4
10 33
14 140 7 Unload/load machine (2) 3 4
15 150 8 Apply final sealant (1) 15 15 4
16 160 9 Final test, wrap leads 18 18 5
30
17 200 10 Package 12 12 5
Total 157 157 157
FIGURE 7-4 Zeta cell rebalancing calculations.