
Page 943 - Industrial Power Engineering and Applications Handbook
P. 943
w
R Y B N
E
I
I
I
I
I
I
I Non-magnetic insulator
I supports of SMC/DMS
I I I stainless steel etc
aluminium or
ir
I
I
I I+
I
I
I
I 6 il
I
I
I
I
I
I
~
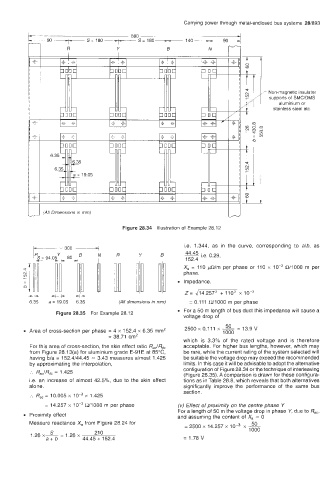
Figure 28.34 Illustration of Example 28.12
i.e. 1.344, as in the curve, corresponding to alb, as
R Y B - 0.29,
i.e.
X, = 110 pQ/m per phase or 110 x Q/1000 m per
phase.
Impedance,
-- ++I- -li- Z= 414.257' + 110' x
6 35 a = 19.05 6.35 (All dimensions in mm) = 0.111 R/1000 m per phase
For a 50 m length of bus duct this impedance will cause a
Figure 28.35 For Example 28.1 2
voltage drop of
50
Area of cross-section per phase = 4 x 152.4 x 6.35 mm2 2500~0.111 x - = 13.9V
1000
= 38.71 cm2
which is 3.3% of the rated voltage and is therefore
For this area of cross-section, the skin effect ratio Ra,/Rd, acceptable. For higher bus lengths, however, which may
from Figure 28.13(a) for aluminium grade E-91E at 85"C, be rare, while the current rating of the system selected will
having bla = 152.4144.45 = 3.43 measures almost 1.425 be suitable the voltage drop may exceed the recommended
by approximating the interpolation, limits. In this case it will be advisable to adopt the alternative
:. RacIRdc = 1.425 configuration of Figure 28.34 or the technique of interleaving
(Figure 28.35). A comparison is drawn for these configura-
i.e. an increase of almost 42.5%, due to the skin effect tions as in Table 28.8, which reveals that both alternatives
alone. significantly improve the performance of the same bus
section.
:. R,, = 10.005 x 1 0-3 x 1.425
= 14.257 x CY1000 m per phase (v) Effect of proximity on the centre phase Y
For a length of 50 m the voltage drop in phase Y, due to R,,,
Proximity effect and assuming the content of X, = 0
Measure reactance X, from Figure 28.24 for 50
= 2500 x 14.257 x 1 0-3 x -
21 0 1000
1.26 x- =1.26x
a+b 44.45 + 152.4 = 1.78 V