
Page 219 - Innovations in Intelligent Machines
P. 219
212 S. Pr¨uter et al.
To simplify the task for the neural network, the network adopts a compact
coding for the input patterns. This was achieved in the following way. The
origin of the coordinate system is set to the robot’s current position, and all
other vectors are given relative to that one. The network’s output is also given
in relative coordinates. The input vector consists of the following nine values:
six values for the position and orientation of the previous two time steps,
and three values for the target position and orientation. The output vector
has three values as well. For training and testing, 800 plus 400 patterns were
obtained by means of practical experiments.
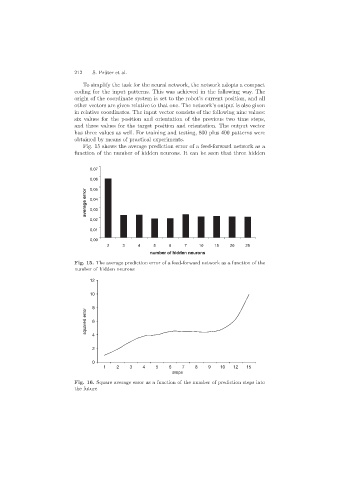
Fig. 15 shows the average prediction error of a feed-forward network as a
function of the number of hidden neurons. It can be seen that three hidden
0,07
0,06
0,05
average error 0,04
0,03
0,02
0,01
0,00
2 3 4 5 6 7 10 15 20 25
number of hidden neurons
Fig. 15. The average prediction error of a feed-forward network as a function of the
number of hidden neurons
12
10
8
squared error 6 4
2
0
1 2 3 4 5 6 7 8 9 10 12 15
steps
Fig. 16. Square average error as a function of the number of prediction steps into
the future