
Page 265 - Integrated Wireless Propagation Models
P. 265
M i c r o c e I P r e d i c t i o n M o d e I s 243
I
o .-.--.-.,-.--.-.--.
-10
-20
� -30
(i; -40
3:
0 �
-50
Cll
� -60 -- Measured
- - - -- Calculated
-70
1
-80 900 MHz
-1500 -1000 -500 0
Projected distance X (feet)
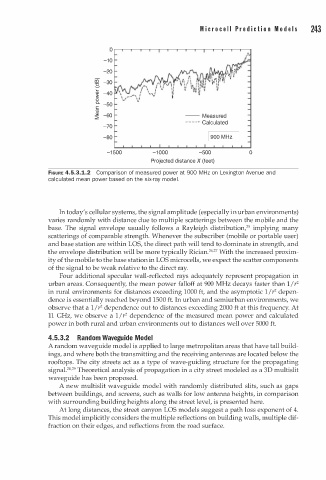
FIGURE 4.5.3.1.2 Comparison of measured power at 900 MHz on Lexington Avenue and
calculated mean power based on the six-ray mod l .
e
In today's cellular systems, the signal amplitude (especially n urban environments)
i
varies randomly with distance due to multiple scatterings between the mobile and the
base. The signal envelope usually follows a Rayleigh distribution/5 implying many
scatterings of comparable strength. Whenever the subscriber (mobile or portable user)
and base station are within LOS, the direct path will tend to dominate in strength, and
2 2
the envelope distribution will be more typically Rician. 6• 7 With the increased proxim
ity of the mobile to the base station in LOS microcells, we expect the scatter components
of the signal to be weak relative to the direct ray.
Four additional specular wall-reflected rays adequately represent propagation in
urban areas. Consequently, the mean power falloff at 900 MHz decays faster than / r 2
1
2
in rural environments for distances exceeding 1000 ft, and the asymptotic 1 I r depen
dence is essentially reached beyond 1500 ft. In urban and semi urban environments, we
2
observe that a / r dependence out to distances exceeding 2000 ft at this frequency. At
1
2
l
11 GHz, we observe a / r dependence of the measured mean power and calculated
power in both rural and urban environments out to distances well over 5000 ft.
4.5.3.2 Random Waveguide Model
A random waveguide model is applied to large metropolitan areas that have tall build
ings, and where both the transmitting and the receiving antennas are located below the
rooftops. The city streets act as a type of wave-guiding structure for the propagating
2
signaP8• 9 Theoretical analysis of propagation in a city street modeled as a 3D multislit
waveguide has been proposed.
A new multislit waveguide model with randomly distributed slits, such as gaps
between buildings, and screens, such as walls for low antenna heights, in comparison
with surrounding building heights along the street level, is presented here.
At long distances, the street canyon LOS models suggest a path loss exponent of 4.
This model implicitly considers the multiple reflections on building walls, multiple dif
fraction on their edges, and reflections from the road surface.