
Page 268 - System on Package_ Miniaturization of the Entire System
P. 268
242 Cha pte r F o u r
0
−20
−40
S12(dB) −60
−80 0
−10
−100 Solid line: Model −20 Dotted line: Measurement
Dotted line: Measurement −30 Solid line: Model
−120 −40
2 4 6 8 10 12 14 −50
S12(dB) −70
Frequency (Hz) −60
−80
−90
−100
−110
2.5
1.5 2 2.5 3 3.5 4 4.5 5 5.5 6
Frequency (Hz)
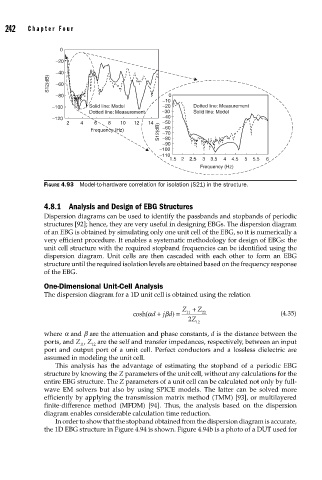
FIGURE 4.93 Model-to-hardware correlation for isolation (S21) in the structure.
4.8.1 Analysis and Design of EBG Structures
Dispersion diagrams can be used to identify the passbands and stopbands of periodic
structures [92]; hence, they are very useful in designing EBGs. The dispersion diagram
of an EBG is obtained by simulating only one unit cell of the EBG, so it is numerically a
very efficient procedure. It enables a systematic methodology for design of EBGs: the
unit cell structure with the required stopband frequencies can be identified using the
dispersion diagram. Unit cells are then cascaded with each other to form an EBG
structure until the required isolation levels are obtained based on the frequency response
of the EBG.
One-Dimensional Unit-Cell Analysis
The dispersion diagram for a 1D unit cell is obtained using the relation
Z + Z
cosh(αd + β j ) d = 11 22 (4.35)
2 Z
12
where a and b are the attenuation and phase constants, d is the distance between the
ports, and Z , Z are the self and transfer impedances, respectively, between an input
11
12
port and output port of a unit cell. Perfect conductors and a lossless dielectric are
assumed in modeling the unit cell.
This analysis has the advantage of estimating the stopband of a periodic EBG
structure by knowing the Z parameters of the unit cell, without any calculations for the
entire EBG structure. The Z parameters of a unit cell can be calculated not only by full-
wave EM solvers but also by using SPICE models. The latter can be solved more
efficiently by applying the transmission matrix method (TMM) [93], or multilayered
finite-difference method (MFDM) [94]. Thus, the analysis based on the dispersion
diagram enables considerable calculation time reduction.
In order to show that the stopband obtained from the dispersion diagram is accurate,
the 1D EBG structure in Figure 4.94 is shown. Figure 4.94b is a photo of a DUT used for