
Page 272 - System on Package_ Miniaturization of the Entire System
P. 272
246 Cha pte r F o u r
propagation toward any directions. This complete stopband is regarded as the stopband
in the 2D EBG structure. Figure 4.97d shows the measured data of the transmission
coefficient S from port 1 to port 2 and to port 3 shown in Figure 4.97a together with the
21
colored area, which indicates the stopband predicted with the dispersion-diagram
analysis. Figure 4.97d shows that the 2D dispersion-diagram analysis provides a good
prediction of the stopband.
4.8.2 Application of EBGs in Power Supply Noise Suppression
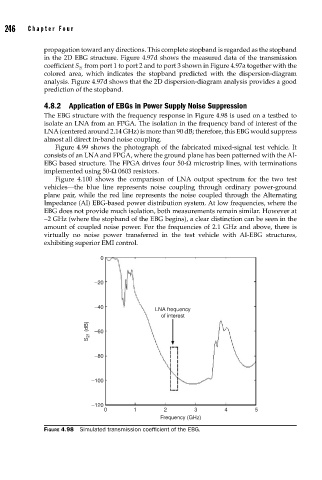
The EBG structure with the frequency response in Figure 4.98 is used on a testbed to
isolate an LNA from an FPGA. The isolation in the frequency band of interest of the
LNA (centered around 2.14 GHz) is more than 90 dB; therefore, this EBG would suppress
almost all direct in-band noise coupling.
Figure 4.99 shows the photograph of the fabricated mixed-signal test vehicle. It
consists of an LNA and FPGA, where the ground plane has been patterned with the AI-
EBG based structure. The FPGA drives four 50-Ω microstrip lines, with terminations
implemented using 50-Ω 0603 resistors.
Figure 4.100 shows the comparison of LNA output spectrum for the two test
vehicles—the blue line represents noise coupling through ordinary power-ground
plane pair, while the red line represents the noise coupled through the Alternating
Impedance (AI) EBG-based power distribution system. At low frequencies, where the
EBG does not provide much isolation, both measurements remain similar. However at
∼2 GHz (where the stopband of the EBG begins), a clear distinction can be seen in the
amount of coupled noise power. For the frequencies of 2.1 GHz and above, there is
virtually no noise power transferred in the test vehicle with AI-EBG structures,
exhibiting superior EMI control.
0
–20
–40
LNA frequency
of interest
S 21 (dB) –60
–80
–100
–120
0 1 2 3 4 5
Frequency (GHz)
FIGURE 4.98 Simulated transmission coeffi cient of the EBG.