
Page 269 - System on Package_ Miniaturization of the Entire System
P. 269
Mixed-Signal (SOP) Design 243
Port 1 (0, 15.2) Port 2 (61.7, 15.2)
y
x
(0, 0)
(a)
(b)
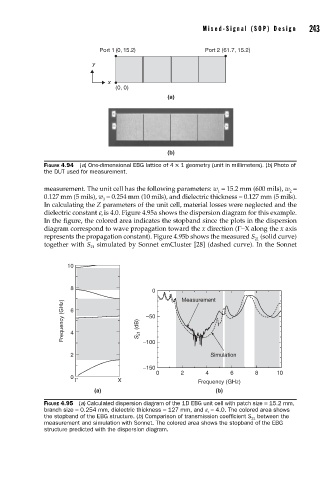
FIGURE 4.94 (a) One-dimensional EBG lattice of 4 × 1 geometry (unit in millimeters). (b) Photo of
the DUT used for measurement.
measurement. The unit cell has the following parameters: w = 15.2 mm (600 mils), w =
1 2
0.127 mm (5 mils), w = 0.254 mm (10 mils), and dielectric thickness = 0.127 mm (5 mils).
3
In calculating the Z parameters of the unit cell, material losses were neglected and the
dielectric constant e is 4.0. Figure 4.95a shows the dispersion diagram for this example.
r
In the figure, the colored area indicates the stopband since the plots in the dispersion
diagram correspond to wave propagation toward the x direction (Γ−X along the x axis
represents the propagation constant). Figure 4.95b shows the measured S (solid curve)
21
together with S simulated by Sonnet emCluster [28] (dashed curve). In the Sonnet
21
10
8
0 Measurement
Frequency (GHz) 6 4 S 21 (dB) –50
2 –100 Simulation
–150
0 2 4 6 8 10
0 Γ X Frequency (GHz)
(a) (b)
FIGURE 4.95 (a) Calculated dispersion diagram of the 1D EBG unit cell with patch size = 15.2 mm,
branch size = 0.254 mm, dielectric thickness = 127 mm, and e r = 4.0. The colored area shows
the stopband of the EBG structure. (b) Comparison of transmission coeffi cient S 21 between the
measurement and simulation with Sonnet. The colored area shows the stopband of the EBG
structure predicted with the dispersion diagram.