
Page 265 - System on Package_ Miniaturization of the Entire System
P. 265
Mixed-Signal (SOP) Design 239
10 0
10 –1 Black-measurement
Impedance (Ω) 10 –2 Red-model
10 –3
10 7 10 8 10 9 10 10
Frequency (Hz)
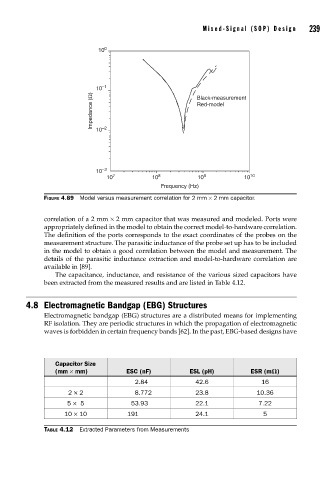
FIGURE 4.89 Model versus measurement correlation for 2 mm × 2 mm capacitor.
correlation of a 2 mm × 2 mm capacitor that was measured and modeled. Ports were
appropriately defined in the model to obtain the correct model-to-hardware correlation.
The definition of the ports corresponds to the exact coordinates of the probes on the
measurement structure. The parasitic inductance of the probe set up has to be included
in the model to obtain a good correlation between the model and measurement. The
details of the parasitic inductance extraction and model-to-hardware correlation are
available in [89].
The capacitance, inductance, and resistance of the various sized capacitors have
been extracted from the measured results and are listed in Table 4.12.
4.8 Electromagnetic Bandgap (EBG) Structures
Electromagnetic bandgap (EBG) structures are a distributed means for implementing
RF isolation. They are periodic structures in which the propagation of electromagnetic
waves is forbidden in certain frequency bands [62]. In the past, EBG-based designs have
Capacitor Size
(mm × mm) ESC (nF) ESL (pH) ESR (m )
2.84 42.6 16
2 × 2 8.772 23.8 10.36
5 × 5 53.93 22.1 7.22
10 × 10 191 24.1 5
TABLE 4.12 Extracted Parameters from Measurements