
Page 192 - Sami Franssila Introduction to Microfabrication
P. 192
CMP: Chemical–Mechanical Polishing 171
(a) (b) (c)
Figure 16.10 (a) Ideal CMP result; (b) erosion and
dishing and (c) plug recess (chemical attack)
are attached to the pad, and the slurry is replaced by
particle-free chemicals.
Temperature is not constant during CMP: friction eas-
◦
ily leads to 10 C temperature rise, which is detrimental
1 to reproducibility and uniformity. Rates of chemical
reactions go up as expected, and this temperature
2 x 1.000 µm/div rise can easily double the removal rate. Pad hardness
z 15.000 nm/div decreases as temperature goes up, which leads to more
µm asperities in contact with the wafer and reduced local
LTO oxide, 16.1.2002 contact pressure. This effect, is, however, not significant
lto-ox.001
compared to chemical rate increase.
(a)
16.6.1 Post-CMP cleaning
The introduction of CMP was obviously resisted by
many people because the very idea of bringing zillions
of particles, intentionally, on the wafer was against all
accepted cleanroom and manufacturing policies. Post-
CMP cleaning was, and remains, a topic of paramount
importance. Brush cleaning and other physical cleaning
techniques are good for rather large particles, but as
always, the smaller particles pose problems. RCA-
1 cleaning is efficient in particle removal, but its
1
use is limited on metallized wafers. In addition to
the particle problem, there is metal contamination:
2 x 1.000 µm/div potassium hydroxide is a common slurry liquid, and
z 15.000 nm/div copper residues may be embedded in PSG, which is a
µm
waspkl.001 soft material. HF etching can remove a thin top layer
of PSG, and reduce the amount of copper. In order
(b) to minimize particle and chemical contamination from
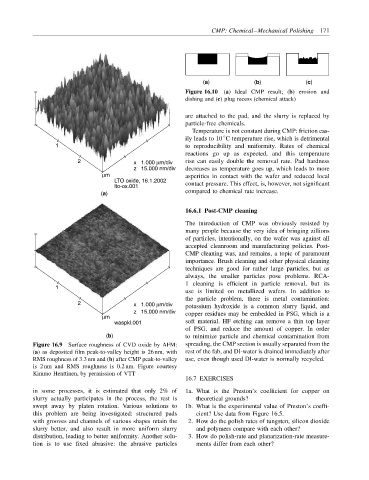
Figure 16.9 Surface roughness of CVD oxide by AFM: spreading, the CMP section is usually separated from the
(a) as deposited film peak-to-valley height is 26 nm, with rest of the fab, and DI-water is drained immediately after
RMS roughness of 3.3 nm and (b) after CMP peak-to-valley use, even though used DI-water is normally recycled.
is 2 nm and RMS roughness is 0.2 nm. Figure courtesy
Kimmo Henttinen, by permission of VTT
16.7 EXERCISES
in some processes, it is estimated that only 2% of 1a. What is the Preston’s coefficient for copper on
slurry actually participates in the process, the rest is theoretical grounds?
swept away by platen rotation. Various solutions to 1b. What is the experimental value of Preston’s coeffi-
this problem are being investigated: structured pads cient? Use data from Figure 16.5.
with grooves and channels of various shapes retain the 2. How do the polish rates of tungsten, silicon dioxide
slurry better, and also result in more uniform slurry and polymers compare with each other?
distribution, leading to better uniformity. Another solu- 3. How do polish-rate and planarization-rate measure-
tion is to use fixed abrasive: the abrasive particles ments differ from each other?