
Page 492 -
P. 492
2500
3000 PPM
Oxygen 21%
2000
2000 PPM
Raw sensor signal (mV) 1500 300 PPM
1000 PPM
1000
RP-1 Vapor 0%
Hydrogen 0% 0%
500
0
0 100 200 300 400 500 600 700 800 900 1000
Time (sec)
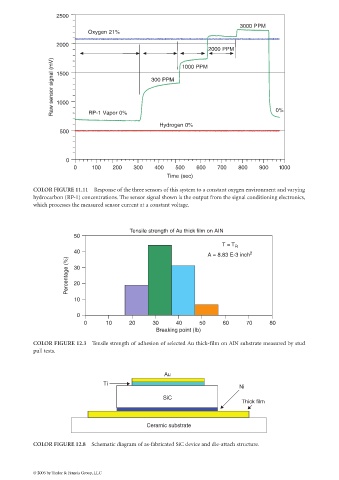
COLOR FIGURE 11.11 Response of the three sensors of this system to a constant oxygen environment and varying
hydrocarbon (RP-1) concentrations. The sensor signal shown is the output from the signal conditioning electronics,
which processes the measured sensor current at a constant voltage.
Tensile strength of Au thick film on AIN
50
T = T R
40 2
A = 8.83 E-3 inch
Percentage (%) 30
20
10
0
0 10 20 30 40 50 60 70 80
Breaking point (Ib)
COLOR FIGURE 12.3 Tensile strength of adhesion of selected Au thick-film on AlN substrate measured by stud
pull tests.
Au
Ti
Ni
SiC
Thick film
Ceramic substrate
COLOR FIGURE 12.8 Schematic diagram of as-fabricated SiC device and die-attach structure.
© 2006 by Taylor & Francis Group, LLC