
Page 497 -
P. 497
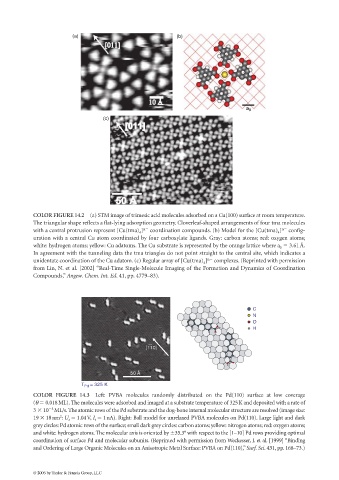
(a)                                  (b)


                                                                                       a 0

                                     (c)


             COLOR FIGURE 14.2 (a) STM image of trimesic acid molecules adsorbed on a Cu(100) surface at room temperature.
             The triangular shape reflects a flat-lying adsorption geometry. Cloverleaf-shaped arrangements of four tma molecules
             with a central protrusion represent [Cu(tma) ] n   coordination compounds. (b) Model for the [Cu(tma) ] n   config-
                                                  4                                                4
             uration with a central Cu atom coordinated by four carboxylate ligands. Gray: carbon atoms; red: oxygen atoms;
             white: hydrogen atoms; yellow: Cu adatoms. The Cu substrate is represented by the orange lattice where a   3.61 Å.
                                                                                                   0
             In agreement with the tunneling data the tma triangles do not point straight to the central site, which indicates a
             unidentate coordination of the Cu adatom. (c) Regular array of [Cu(tma) ] n   complexes. (Reprinted with permission
                                                                        4
             from Lin, N. et al. [2002] “Real-Time Single-Molecule Imaging of the Formation and Dynamics of Coordination
             Compounds,” Angew. Chem. Int. Ed. 41, pp. 4779–83).


                                                                                          C
                                                                                          N
                                                                                          O
                                                                                          H


                                                    [110]


                                               50
                                               50 Å
                              T Pd  = 325 K
             COLOR  FIGURE  14.3 Left: PVBA  molecules  randomly  distributed  on  the  Pd(110)  surface  at  low  coverage
             (θ   0.018ML). The molecules were adsorbed and imaged at a substrate temperature of 325K and deposited with a rate of
                   5
             3   10 ML/s.The atomic rows of the Pd substrate and the dog-bone internal molecular structure are resolved (image size:
             19   18nm : U   1.04V, I   1nA). Right: Ball model for unrelaxed PVBA molecules on Pd(110). Large light and dark
                      2
                         t
                                  t
             grey circles: Pd atomic rows of the surface; small dark grey circles: carbon atoms; yellow: nitrogen atoms; red: oxygen atoms;
             and white: hydrogen atoms. The molecular axis is oriented by  35.3° with respect to the [1–10] Pd rows providing optimal
             coordination of surface Pd and molecular subunits. (Reprinted with permission from Weckesser, J. et al. [1999] “Binding
             and Ordering of Large Organic Molecules on an Anisotropic Metal Surface: PVBA on Pd(110),”Surf. Sci. 431, pp. 168–73.)


             © 2006 by Taylor & Francis Group, LLC