
Page 496 -
P. 496
(a) (c)
(b) (d)
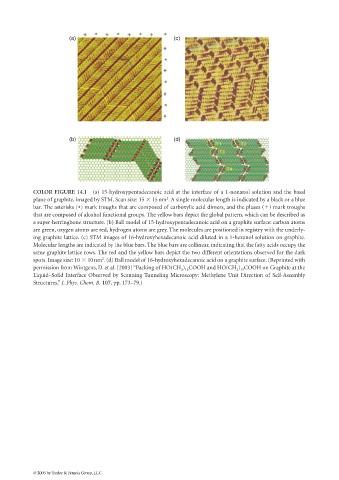
COLOR FIGURE 14.1 (a) 15-hydroxypentadecanoic acid at the interface of a 1-nonanol solution and the basal
2
plane of graphite, imaged by STM. Scan size: 15 15 nm . A single molecular length is indicated by a black or a blue
bar. The asterisks (∗) mark troughs that are composed of carboxylic acid dimers, and the pluses ( ) mark troughs
that are composed of alcohol functional groups. The yellow bars depict the global pattern, which can be described as
a super-herringbone structure. (b) Ball model of 15-hydroxypentadecanoic acid on a graphite surface: carbon atoms
are green, oxygen atoms are red, hydrogen atoms are grey. The molecules are positioned in registry with the underly-
ing graphite lattice. (c) STM images of 16-hydroxyhexadecanoic acid diluted in a 1-hexanol solution on graphite.
Molecular lengths are indicated by the blue bars. The blue bars are collinear, indicating that the fatty acids occupy the
same graphite lattice rows. The red and the yellow bars depict the two different orientations observed for the dark
2
spots. Image size: 10 10nm . (d) Ball model of 16-hydroxyhexadecanoic acid on a graphite surface. (Reprinted with
permission from Wintgens, D. et al. [2003] “Packing of HO(CH ) COOH and HO(CH ) COOH on Graphite at the
2 14 2 15
Liquid–Solid Interface Observed by Scanning Tunneling Microscopy: Methylene Unit Direction of Self-Assembly
Structures,” J. Phys. Chem. B. 107, pp. 173–79.)
© 2006 by Taylor & Francis Group, LLC