
Page 288 - Machine Learning for Subsurface Characterization
P. 288
250 Machine learning for subsurface characterization
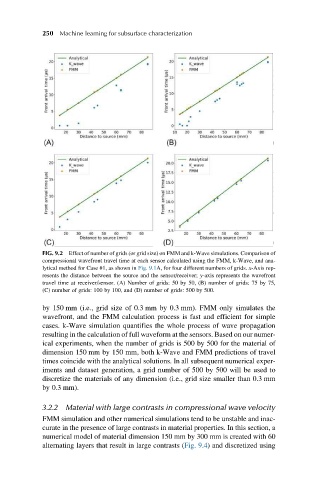
FIG. 9.2 Effect of number of grids (or grid size) on FMM and k-Wave simulations. Comparison of
compressional wavefront travel time at each sensor calculated using the FMM, k-Wave, and ana-
lytical method for Case #1, as shown in Fig. 9.1A, for four different numbers of grids. x-Axis rep-
resents the distance between the source and the sensor/receiver; y-axis represents the wavefront
travel time at receiver/sensor. (A) Number of grids: 50 by 50, (B) number of grids: 75 by 75,
(C) number of grids: 100 by 100, and (D) number of grids: 500 by 500.
by 150 mm (i.e., grid size of 0.3 mm by 0.3 mm). FMM only simulates the
wavefront, and the FMM calculation process is fast and efficient for simple
cases. k-Wave simulation quantifies the whole process of wave propagation
resulting in the calculation of full waveform at the sensors. Based on our numer-
ical experiments, when the number of grids is 500 by 500 for the material of
dimension 150 mm by 150 mm, both k-Wave and FMM predictions of travel
times coincide with the analytical solutions. In all subsequent numerical exper-
iments and dataset generation, a grid number of 500 by 500 will be used to
discretize the materials of any dimension (i.e., grid size smaller than 0.3 mm
by 0.3 mm).
3.2.2 Material with large contrasts in compressional wave velocity
FMM simulation and other numerical simulations tend to be unstable and inac-
curate in the presence of large contrasts in material properties. In this section, a
numerical model of material dimension 150 mm by 300 mm is created with 60
alternating layers that result in large contrasts (Fig. 9.4) and discretized using