
Page 290 - Machine Learning for Subsurface Characterization
P. 290
252 Machine learning for subsurface characterization
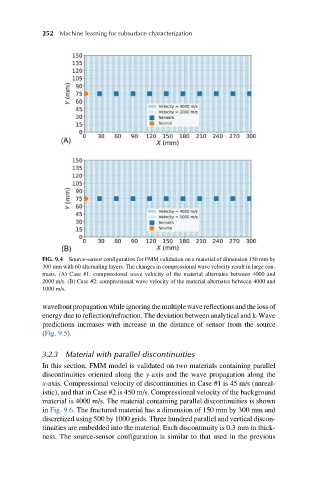
FIG. 9.4 Source-sensor configuration for FMM validation on a material of dimension 150 mm by
300 mm with 60 alternating layers. The changes in compressional wave velocity result in large con-
trasts. (A) Case #1: compressional wave velocity of the material alternates between 4000 and
2000 m/s. (B) Case #2: compressional wave velocity of the material alternates between 4000 and
1000 m/s.
wavefrontpropagation while ignoring themultiplewavereflectionsandthe lossof
energy due to reflection/refraction. The deviation between analytical and k-Wave
predictions increases with increase in the distance of sensor from the source
(Fig. 9.5).
3.2.3 Material with parallel discontinuities
In this section, FMM model is validated on two materials containing parallel
discontinuities oriented along the y-axis and the wave propagation along the
x-axis. Compressional velocity of discontinuities in Case #1 is 45 m/s (unreal-
istic), and that in Case #2 is 450 m/s. Compressional velocity of the background
material is 4000 m/s. The material containing parallel discontinuities is shown
in Fig. 9.6. The fractured material has a dimension of 150 mm by 300 mm and
discretized using 500 by 1000 grids. Three hundred parallel and vertical discon-
tinuities are embedded into the material. Each discontinuity is 0.3 mm in thick-
ness. The source-sensor configuration is similar to that used in the previous