
Page 291 - Machine Learning for Subsurface Characterization
P. 291
Classification of sonic wave Chapter 9 253
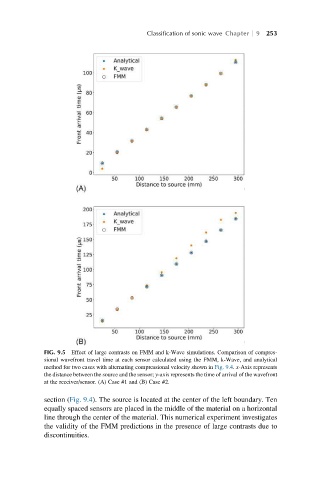
FIG. 9.5 Effect of large contrasts on FMM and k-Wave simulations. Comparison of compres-
sional wavefront travel time at each sensor calculated using the FMM, k-Wave, and analytical
method for two cases with alternating compressional velocity shown in Fig. 9.4. x-Axis represents
the distance between the source and the sensor; y-axis represents the time of arrival of the wavefront
at the receiver/sensor. (A) Case #1 and (B) Case #2.
section (Fig. 9.4). The source is located at the center of the left boundary. Ten
equally spaced sensors are placed in the middle of the material on a horizontal
line through the center of the material. This numerical experiment investigates
the validity of the FMM predictions in the presence of large contrasts due to
discontinuities.