
Page 293 - Machine Learning for Subsurface Characterization
P. 293
Classification of sonic wave Chapter 9 255
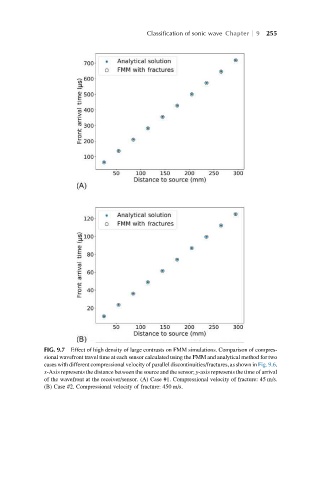
FIG. 9.7 Effect of high density of large contrasts on FMM simulations. Comparison of compres-
sional wavefront travel time at each sensor calculated using the FMM and analytical method for two
cases with different compressional velocity of parallel discontinuities/fractures, as shown in Fig. 9.6.
x-Axis represents the distance between the source and the sensor; y-axis represents the time of arrival
of the wavefront at the receiver/sensor. (A) Case #1. Compressional velocity of fracture: 45 m/s.
(B) Case #2. Compressional velocity of fracture: 450 m/s.