
Page 295 - Machine Learning for Subsurface Characterization
P. 295
Classification of sonic wave Chapter 9 257
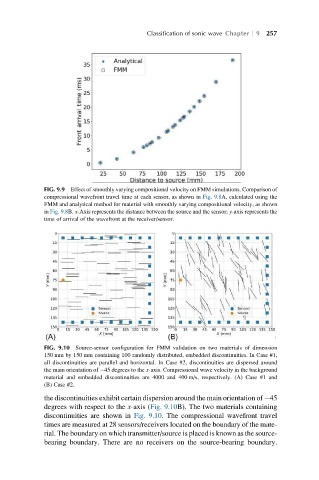
FIG. 9.9 Effect of smoothly varying compositional velocity on FMM simulations. Comparison of
compressional wavefront travel time at each sensor, as shown in Fig. 9.8A, calculated using the
FMM and analytical method for material with smoothly varying compositional velocity, as shown
in Fig. 9.8B. x-Axis represents the distance between the source and the sensor; y-axis represents the
time of arrival of the wavefront at the receiver/sensor.
FIG. 9.10 Source-sensor configuration for FMM validation on two materials of dimension
150 mm by 150 mm containing 100 randomly distributed, embedded discontinuities. In Case #1,
all discontinuities are parallel and horizontal. In Case #2, discontinuities are dispersed around
the main orientation of 45 degrees to the x-axis. Compressional wave velocity in the background
material and embedded discontinuities are 4000 and 400 m/s, respectively. (A) Case #1 and
(B) Case #2.
the discontinuities exhibit certain dispersion around the main orientation of 45
degrees with respect to the x-axis (Fig. 9.10B). The two materials containing
discontinuities are shown in Fig. 9.10. The compressional wavefront travel
times are measured at 28 sensors/receivers located on the boundary of the mate-
rial. The boundary on which transmitter/source is placed is known as the source-
bearing boundary. There are no receivers on the source-bearing boundary.