
Page 300 - Machine Learning for Subsurface Characterization
P. 300
262 Machine learning for subsurface characterization
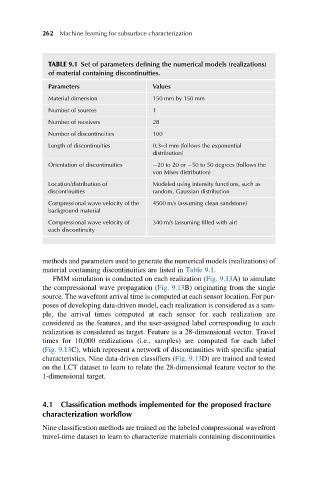
TABLE 9.1 Set of parameters defining the numerical models (realizations)
of material containing discontinuities.
Parameters Values
Material dimension 150 mm by 150 mm
Number of sources 1
Number of receivers 28
Number of discontinuities 100
Length of discontinuities 0.3–3 mm (follows the exponential
distribution)
Orientation of discontinuities 20 to 20 or 50 to 50 degrees (follows the
von Mises distribution)
Location/distribution of Modeled using intensity functions, such as
discontinuities random, Gaussian distribution
Compressional wave velocity of the 4500 m/s (assuming clean sandstone)
background material
Compressional wave velocity of 340 m/s (assuming filled with air)
each discontinuity
methods and parameters used to generate the numerical models (realizations) of
material containing discontinuities are listed in Table 9.1.
FMM simulation is conducted on each realization (Fig. 9.13A) to simulate
the compressional wave propagation (Fig. 9.13B) originating from the single
source. The wavefront arrival time is computed at each sensor location. For pur-
poses of developing data-driven model, each realization is considered as a sam-
ple, the arrival times computed at each sensor for each realization are
considered as the features, and the user-assigned label corresponding to each
realization is considered as target. Feature is a 28-dimensional vector. Travel
times for 10,000 realizations (i.e., samples) are computed for each label
(Fig. 9.13C), which represent a network of discontinuities with specific spatial
characteristics. Nine data-driven classifiers (Fig. 9.13D) are trained and tested
on the LCT dataset to learn to relate the 28-dimensional feature vector to the
1-dimensional target.
4.1 Classification methods implemented for the proposed fracture
characterization workflow
Nine classification methods are trained on the labeled compressional wavefront
travel-time dataset to learn to characterize materials containing discontinuities