Page 221 - Mechanical design of microresonators _ modeling and applications
P. 221

0-07-145538-8_CH04_220_08/30/05


                                          Microbridges: Lumped-Parameter Modeling and Design

                              220   Chapter Four


                                  1.15
                                                                 2
                              r m b
                                    1
                                  1.001                        ct


                                               c1
                                                         0.5
                                                       2
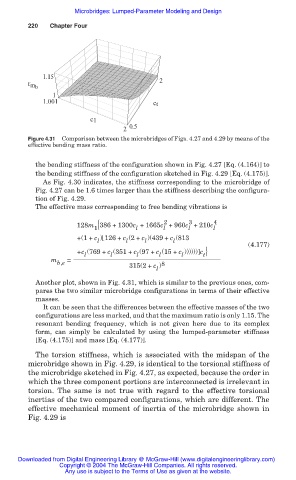
                              Figure 4.31  Comparison between the microbridges of Figs. 4.27 and 4.29 by means of the
                              effective bending mass ratio.

                                the bending stiffness of the configuration shown in Fig. 4.27 [Eq. (4.164)] to
                                the bending stiffness of the configuration sketched in Fig. 4.29 [Eq. (4.175)].
                                  As Fig. 4.30 indicates, the stiffness corresponding to the microbridge of
                                Fig. 4.27 can be 1.6 times larger than the stiffness describing the configura-
                                tion of Fig. 4.29.
                                The effective mass corresponding to free bending vibrations is
                                                                  2      3      4
                                           128m { 386 + 1300c +1665c +960c +210c
                                                1          l      l      l      l
                                           +(1+ c ) 126 + c (2+ c )(439 + c (813
                                                l
                                                        l
                                                             l
                                                                     l
                                                                                         (4.177)
                                           +c (769 + c (351 + c (97 + c (15 + c )))))) c }
                                                    l
                                             l
                                                                 l
                                                           l
                                                                             t
                                                                       l
                                    m   =
                                      b,e                         8
                                                         315(2+ c )
                                                                l
                                Another plot, shown in Fig. 4.31, which is similar to the previous ones, com-
                                pares the two similar microbridge configurations in terms of their effective
                                masses.
                                  It can be seen that the differences between the effective masses of the two
                                configurations are less marked, and that the maximum ratio is only 1.15. The
                                resonant  bending  frequency, which  is  not given here due to its complex
                                form,  can simply be calculated  by using the lumped-parameter stiffness
                                [Eq. (4.175)] and mass [Eq. (4.177)].
                                The torsion stiffness, which is associated with the midspan of the
                              microbridge shown in Fig. 4.29, is identical to the torsional stiffness of
                              the microbridge sketched in Fig. 4.27, as expected, because the order in
                              which the three component portions are interconnected is irrelevant in
                              torsion. The same  is not true with regard to the effective torsional
                              inertias of the two compared configurations, which are different. The
                              effective mechanical moment of inertia of the microbridge shown  in
                              Fig. 4.29 is


                           Downloaded from Digital Engineering Library @ McGraw-Hill (www.digitalengineeringlibrary.com)
                                      Copyright © 2004 The McGraw-Hill Companies. All rights reserved.
                                        Any use is subject to the Terms of Use as given at the website.
   216   217   218   219   220   221   222   223   224   225   226