
Page 223 - Mechanical design of microresonators _ modeling and applications
P. 223
0-07-145538-8_CH04_222_08/30/05
Microbridges: Lumped-Parameter Modeling and Design
222 Chapter Four
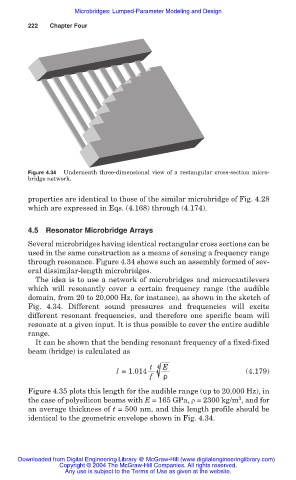
Figure 4.34 Underneath three-dimensional view of a rectangular cross-section micro-
bridge network.
properties are identical to those of the similar microbridge of Fig. 4.28
which are expressed in Eqs. (4.168) through (4.174).
4.5 Resonator Microbridge Arrays
Several microbridges having identical rectangular cross sections can be
used in the same construction as a means of sensing a frequency range
through resonance. Figure 4.34 shows such an assembly formed of sev-
eral dissimilar-length microbridges.
The idea is to use a network of microbridges and microcantilevers
which will resonantly cover a certain frequency range (the audible
domain, from 20 to 20,000 Hz, for instance), as shown in the sketch of
Fig. 4.34. Different sound pressures and frequencies will excite
different resonant frequencies, and therefore one specific beam will
resonate at a given input. It is thus possible to cover the entire audible
range.
It can be shown that the bending resonant frequency of a fixed-fixed
beam (bridge) is calculated as
t 4 E
l =1.014 (4.179)
f ˮ
Figure 4.35 plots this length for the audible range (up to 20,000 Hz), in
3
the case of polysilicon beams with E = 165 GPa, ȡ = 2300 kg/m , and for
an average thickness of t = 500 nm, and this length profile should be
identical to the geometric envelope shown in Fig. 4.34.
Downloaded from Digital Engineering Library @ McGraw-Hill (www.digitalengineeringlibrary.com)
Copyright © 2004 The McGraw-Hill Companies. All rights reserved.
Any use is subject to the Terms of Use as given at the website.