Page 284 - Mechanical design of microresonators _ modeling and applications
P. 284

0-07-145538-8_CH05_283_08/30/05


                                                 Resonant Micromechanical Systems

                                                             Resonant Micromechanical Systems  283
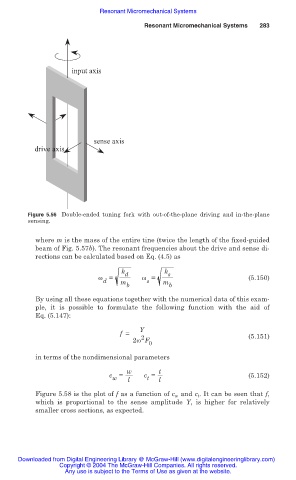


                                          input axis


                                                sense axis
                                drive axis


                              Figure 5.56 Double-ended  tuning fork with out-of-the-plane  driving and  in-the-plane
                              sensing.


                                where m is the mass of the entire tine (twice the length of the fixed-guided
                                beam of Fig. 5.57b). The resonant frequencies about the drive and sense di-
                                rections can be calculated based on Eq. (4.5) as

                                                       k d        k s
                                                 Ȧ =        Ȧ =                          (5.150)
                                                  d    m      s   m
                                                        b           b
                                By using all these equations together with the numerical data of this exam-
                                ple,  it is possible to formulate the following function  with the  aid of
                                Eq. (5.147):
                                                            Y
                                                      f =                                (5.151)
                                                            2
                                                          2Ȧ F
                                                              0
                                in terms of the nondimensional parameters
                                                        w        t
                                                    c  =     c =                         (5.152)
                                                    w    l    t  l
                                Figure 5.58 is the plot of f as a function of c w  and c t . It can be seen that f,
                                which is  proportional to the sense amplitude  Y, is  higher for relatively
                                smaller cross sections, as expected.


                           Downloaded from Digital Engineering Library @ McGraw-Hill (www.digitalengineeringlibrary.com)
                                      Copyright © 2004 The McGraw-Hill Companies. All rights reserved.
                                        Any use is subject to the Terms of Use as given at the website.
   279   280   281   282   283   284   285   286   287   288   289