
Page 158 - Mechatronic Systems Modelling and Simulation with HDLs
P. 158
7.3 DEMONSTRATOR 2: INTERNAL COMBUSTION ENGINE WITH DRIVE TRAIN 147
7.3.3 Simulation
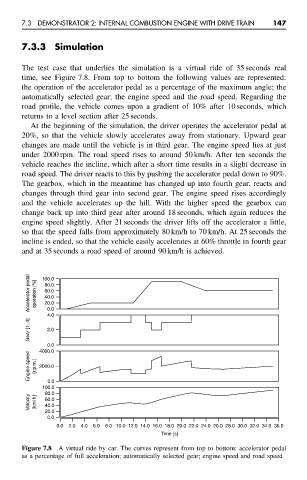
The test case that underlies the simulation is a virtual ride of 35 seconds real
time, see Figure 7.8. From top to bottom the following values are represented:
the operation of the accelerator pedal as a percentage of the maximum angle; the
automatically selected gear; the engine speed and the road speed. Regarding the
road profile, the vehicle comes upon a gradient of 10% after 10 seconds, which
returns to a level section after 25 seconds.
At the beginning of the simulation, the driver operates the accelerator pedal at
20%, so that the vehicle slowly accelerates away from stationary. Upward gear
changes are made until the vehicle is in third gear. The engine speed lies at just
under 2000 rpm. The road speed rises to around 50 km/h. After ten seconds the
vehicle reaches the incline, which after a short time results in a slight decrease in
road speed. The driver reacts to this by pushing the accelerator pedal down to 90%.
The gearbox, which in the meantime has changed up into fourth gear, reacts and
changes through third gear into second gear. The engine speed rises accordingly
and the vehicle accelerates up the hill. With the higher speed the gearbox can
change back up into third gear after around 18 seconds, which again reduces the
engine speed slightly. After 21 seconds the driver lifts off the accelerator a little,
so that the speed falls from approximately 80 km/h to 70 km/h. At 25 seconds the
incline is ended, so that the vehicle easily accelerates at 60% throttle in fourth gear
and at 35 seconds a road speed of around 90 km/h is achieved.
Accelerator pedal operation [%] 100.0
80.0
60.0
40.0
20.0
0.0
4.0
Gear [1..4] 2.0
0.0
4000.0
Engine speed [r.p.m.] 2000.0
0.0
100.0
80.0
Velocity [km/h] 60.0
40.0
20.0
0.0
0.0 2.0 4.0 6.0 8.0 10.0 12.0 14.0 16.0 18.0 20.0 22.0 24.0 26.0 28.0 30.0 32.0 34.0 36.0
Time [s]
Figure 7.8 A virtual ride by car. The curves represent from top to bottom: accelerator pedal
as a percentage of full acceleration; automatically selected gear; engine speed and road speed