
Page 201 -
P. 201
5.3 Experimental Analysis 191
s-polarized
5
5
0 0 1.06 mm
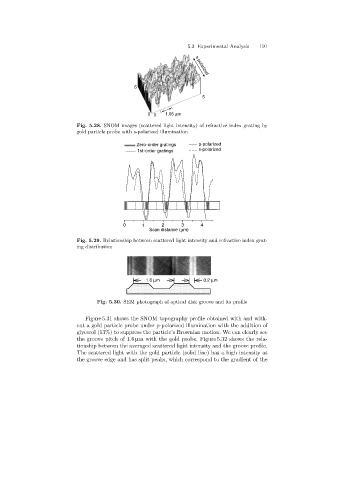
Fig. 5.28. SNOM images (scattered light intensity)of refractive index grating by
gold particle probe with s-polarized illumination
Zero-order gratings p-polarized
1st-order gratings s-polarized
0 1 2 3 4
Scan distance (mm)
Fig. 5.29. Relationship between scattered light intensity and refractive index grat-
ing distribution
1.6 mm 0.2 mm
Fig. 5.30. SEM photograph of optical disk groove and its profile
Figure 5.31 shows the SNOM topography profile obtained with and with-
out a gold particle probe under p-polarized illumination with the addition of
glycerol (13%) to suppress the particle’s Brownian motion. We can clearly see
the groove pitch of 1.6 µm with the gold probe. Figure 5.32 shows the rela-
tionship between the averaged scattered light intensity and the groove profile.
The scattered light with the gold particle (solid line) has a high intensity at
the groove edge and has split peaks, which correspond to the gradient of the