
Page 198 -
P. 198
188 5 Near Field
24 NA = 1.3
Minimum trapping power (mW) 18 8 6 Glycerol 0% 13% 25%
22
l = 1060 nm
20
16
14
12
10
0 4 2
0 1 2 3 4 5
-1
Scanning velocity (mm s )
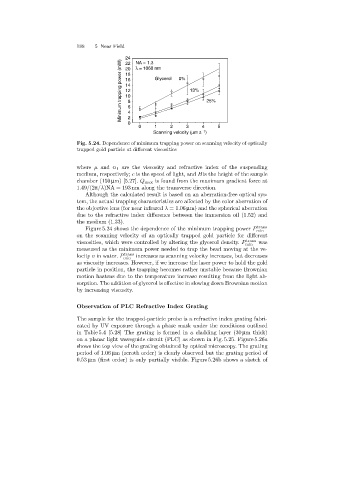
Fig. 5.24. Dependence of minimum trapping power on scanning velocity of optically
trapped gold particle at different viscosities
where µ and n 1 are the viscosity and refractive index of the suspending
medium, respectively; c is the speed of light, and His the height of the sample
chamber (150 µm) [5.27]. Q max is found from the maximum gradient force at
1.49/(2π/λ)NA = 193 nm alongthe transverse direction.
Although the calculated result is based on an aberration-free optical sys-
tem, the actual trappingcharacteristics are affected by the color aberration of
the objective lens (for near infrared λ =1.06 µm) and the spherical aberration
due to the refractive index difference between the immersion oil (1.52) and
the medium (1.33).
Figure 5.24 shows the dependence of the minimum trapping power P trans
min
on the scanningvelocity of an optically trapped gold particle for different
viscosities, which were controlled by alteringthe glycerol density. P trans was
min
measured as the minimum power needed to trap the bead movingat the ve-
trans
locity v in water. P min increases as scanningvelocity increases, but decreases
as viscosity increases. However, if we increase the laser power to hold the gold
particle in position, the trappingbecomes rather unstable because Brownian
motion hastens due to the temperature increase resultingfrom the light ab-
sorption. The addition of glycerol is effective in slowing down Brownian motion
by increasingviscosity.
Observation of PLC Refractive Index Grating
The sample for the trapped-particle probe is a refractive index grating fabri-
cated by UV exposure through a phase mask under the conditions outlined
in Table 5.4 [5.28] The grating is formed in a cladding layer (30 µm thick)
on a planar light waveguide circuit (PLC) as shown in Fig. 5.25. Figure 5.26a
shows the top view of the grating obtained by optical microscopy. The grating
period of 1.06 µm (zeroth order) is clearly observed but the grating period of
0.53 µm (first order) is only partially visible. Figure 5.26b shows a sketch of