
Page 194 -
P. 194
184 5 Near Field 0.9 1 s-polarized
Evanescent field intensity (a.u.) 0.8 experimental
0.7
0.6
0.5
0.4
theoretical
0.3
0.2
0.1
0
500
0
400
300
200
100
Distance from boundary (nm) 600 700
Fig. 5.19. Dependence of measured evanescent field intensity on distance from
boundary. Theoretical result is also shown for reference
2.0
Y (mm) 1.5
1.0
0.5
0
0 0.5 1.0 1.5 2.0 2.5 3.0 3.5 4.0
X (mm)
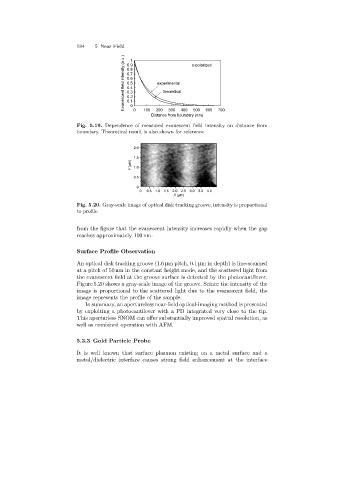
Fig. 5.20. Gray-scale image of optical disk tracking groove; intensity is proportional
to profile
from the figure that the evanescent intensity increases rapidly when the gap
reaches approximately 100 nm.
Surface Profile Observation
An optical disk trackinggroove (1.6 µm pitch, 0.1 µm in depth) is line-scanned
at a pitch of 50 nm in the constant height mode, and the scattered light from
the evanescent field at the groove surface is detected by the photocantilever.
Figure 5.20 shows a gray-scale image of the groove. Scince the intensity of the
image is proportional to the scattered light due to the evanescent field, the
image represents the profile of the sample.
In summary, an apertureless near-field optical-imaging method is presented
by exploitinga photocantilever with a PD integrated very close to the tip.
This aperturless SNOM can offer substantially improved spatial resolution, as
well as combined operation with AFM.
5.3.3 Gold Particle Probe
It is well known that surface plasmon existingon a metal surface and a
metal/dielectric interface causes strongfield enhancement at the interface