
Page 191 -
P. 191
5.3 Experimental Analysis 181
(a) (b)
Photodiode Substrate
10mm Al wire
Photodiode
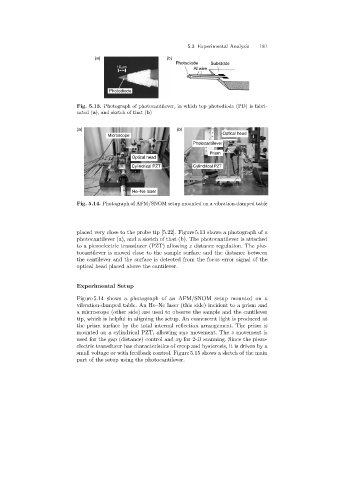
Fig. 5.13. Photograph of photocantilever, in which top photodiode (PD)is fabri-
cated (a), and sketch of that (b)
(a) (b)
Optical head
Microscope
Photocantilever
Prism
Optical head
Cylindrical PZT Cylindrical PZT
He–Ne laser
Fig. 5.14. Photograph of AFM/SNOM setup mounted on a vibration-damped table
placed very close to the probe tip [5.22]. Figure 5.13 shows a photograph of a
photocantilever (a), and a sketch of that (b). The photocantilever is attached
to a piezoelectric transducer (PZT) allowing z distance regulation. The pho-
tocantilever is moved close to the sample surface and the distance between
the cantilever and the surface is detected from the focus error signal of the
optical head placed above the cantilever.
Experimental Setup
Figure 5.14 shows a photograph of an AFM/SNOM setup mounted on a
vibration-damped table. An He–Ne laser (this side) incident to a prism and
a microscope (other side) are used to observe the sample and the cantilever
tip, which is helpful in aligning the setup. An evanescent light is produced at
the prism surface by the total internal reflection arrangement. The prism is
mounted on a cylindrical PZT, allowing xyz movement. The z movement is
used for the gap (distance) control and xy for 2-D scanning. Since the piezo-
electric transducer has characteristics of creep and hysteresis, it is driven by a
small voltage or with feedback control. Figure 5.15 shows a sketch of the main
part of the setup usingthe photocantilever.