
Page 193 -
P. 193
5.3 Experimental Analysis 183
Evanescent field
Black sheet
He–Ne laser
He–Ne laser
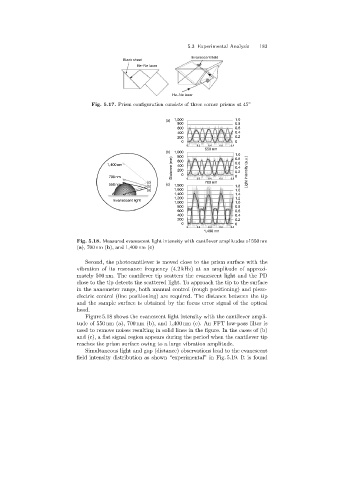
Fig. 5.17. Prism configuration consists of three corner prisms at 45 ◦
(a) 1,000 1.0
800 0.8
600 0.6
400 0.4
200 0.2
0 0
0 0.2 0.4 0.6 0.8
550 nm
(b) 1,000 1.0
800
Distance (nm) 200 0.4 Light intensity (a.u.)
0.6
1,400 nm 600 0.8
400
0.2
700 nm 0 0 0.2 0.4 0.6 0.8 0
(c) 700 nm
550 nm (c) 1,800
(b) 1.8
(a) 1,600 1.6
1,400 1.4
1,200 1.2
Evanescent light
1,000 1.0
800 0.8
600 0.6
400 0.4
200 0.2
0 0
0 0.2 0.4 0.6 0.8
1,400 nm
Fig. 5.18. Measured evanescent light intensity with cantilever amplitudes of 550 nm
(a), 700 nm (b), and 1,400 nm (c)
Second, the photocantilever is moved close to the prism surface with the
vibration of its resonance frequency (4.2 kHz) at an amplitude of approxi-
mately 500 nm. The cantilever tip scatters the evanescent light and the PD
close to the tip detects the scattered light. To approach the tip to the surface
in the nanometer range, both manual control (rough positioning) and piezo-
electric control (fine positioning) are required. The distance between the tip
and the sample surface is obtained by the focus error signal of the optical
head.
Figure 5.18 shows the evanescent light intensity with the cantilever ampli-
tude of 550 nm (a), 700 nm (b), and 1,400 nm (c). An FFT low-pass filter is
used to remove noises resultingin solid lines in the figure. In the cases of (b)
and (c), a flat signal region appears during the period when the cantilever tip
reaches the prism surface owingto a large vibration amplitude.
Simultaneous light and gap (distance) observations lead to the evanescent
field intensity distribution as shown “experimental” in Fig. 5.19. It is found