
Page 192 -
P. 192
182 5 Near Field
Optical head
LD PD Distance signal
PZT
Prism
SNOM Signal
He–Ne laser
Photocantilever
Cylindrical PZT Evanescent field
Sample
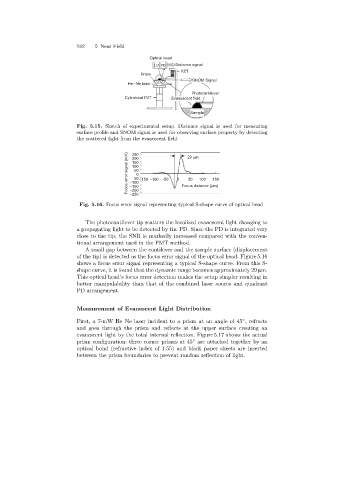
Fig. 5.15. Sketch of experimental setup. Distance signal is used for measuring
surface profile and SNOM signal is used for observing surface property by detecting
the scattered light from the evanescent field
250
Focus error signal (mV) -100 0 -150 -100 -50 0 Focus distance (mm)
29 mm
200
150
100
50
-50
150
100
50
-150
-200
-250
Fig. 5.16. Focus error signal representing typical S-shape curve of optical head
The photocantilever tip scatters the localized evanescent light changing to
a propagating light to be detected by the PD. Since the PD is integrated very
close to the tip, the SNR is markedly increased compared with the conven-
tional arrangement used in the PMT method.
A small gap between the cantilever and the sample surface (displacement
of the tip) is detected as the focus error signal of the optical head. Figure 5.16
shows a focus error signal representing a typical S-shape curve. From this S-
shape curve, it is found that the dynamic range becomes approximately 29 µm.
This optical head’s focus error detection makes the setup simpler resultingin
better manipulability than that of the combined laser source and quadrant
PD arrangement.
Measurement of Evanescent Light Distribution
First, a 7-mW He–Ne laser incident to a prism at an angle of 45 , refracts
◦
and goes through the prism and reflects at the upper surface creating an
evanescent light by the total internal reflection. Figure 5.17 shows the actual
prism configuration: three corner prisms at 45 are attached together by an
◦
optical bond (refractive index of 1.55) and black paper sheets are inserted
between the prism boundaries to prevent random reflection of light.