
Page 200 -
P. 200
190 5 Near Field
Table 5.5. Conditions for observation of refractive index grating using optically
trapped gold particle
gold particle diameter 100 nm
medium water
YAG laser intensity 25 mW (λ =1, 064 nm)
Ar + laser intensity 130 µW(λ = 488 nm)
scan velocity 1.6 µms −1
scan pitch 50 nm
scan area 5 × 5 µm 2
measurement time 5 min
p-polarized
5
5
1.06 mm
0 0
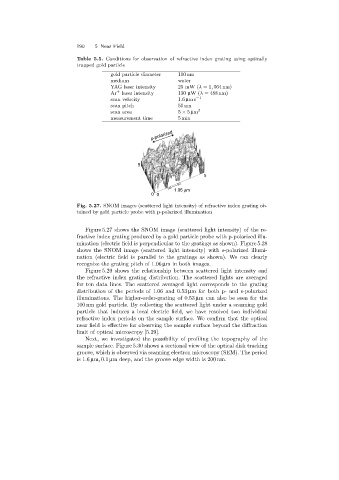
Fig. 5.27. SNOM images (scattered light intensity)of refractive index grating ob-
tained by gold particle probe with p-polarized illumination
Figure 5.27 shows the SNOM image (scattered light intensity) of the re-
fractive index grating produced by a gold particle probe with p-polarized illu-
mination (electric field is perpendicular to the gratings as shown). Figure 5.28
shows the SNOM image (scattered light intensity) with s-polarized illumi-
nation (electric field is parallel to the gratings as shown). We can clearly
recognize the grating pitch of 1.06 µm in both images.
Figure 5.29 shows the relationship between scattered light intensity and
the refractive index grating distribution. The scattered lights are averaged
for ten data lines. The scattered averaged light corresponds to the grating
distribution of the periods of 1.06 and 0.53 µm for both p- and s-polarized
illuminations. The higher-order-grating of 0.53 µm can also be seen for the
100 nm gold particle. By collecting the scattered light under a scanning gold
particle that induces a local electric field, we have resolved two individual
refractive index periods on the sample surface. We confirm that the optical
near field is effective for observingthe sample surface beyond the diffraction
limit of optical microscopy [5.29].
Next, we investigated the possibility of profiling the topography of the
sample surface. Figure 5.30 shows a sectional view of the optical disk tracking
groove, which is observed via scanning electron microscopy (SEM). The period
is 1.6 µm, 0.1 µm deep, and the groove edge width is 200 nm.