
Page 53 - A Practical Guide from Design Planning to Manufacturing
P. 53
The Evolution of the Microprocessor 29
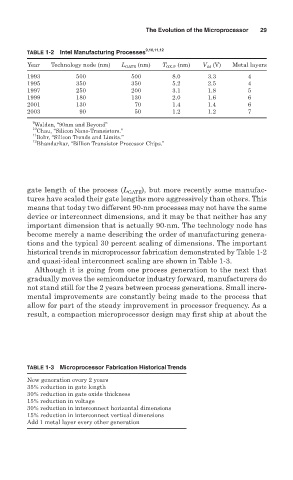
TABLE 1-2 Intel Manufacturing Processes 9,10,11,12
Year Technology node (nm) L GATE (nm) T OX-P (nm) V dd (V) Metal layers
1993 500 500 8.0 3.3 4
1995 350 350 5.2 2.5 4
1997 250 200 3.1 1.8 5
1999 180 130 2.0 1.6 6
2001 130 70 1.4 1.4 6
2003 90 50 1.2 1.2 7
9
Walden, “90nm and Beyond”
10
Chau, “Silicon Nano-Transistors.”
11
Bohr, “Silicon Trends and Limits.”
12
Bhandarkar, “Billion Transistor Processor Chips.”
gate length of the process (L GATE ), but more recently some manufac-
tures have scaled their gate lengths more aggressively than others. This
means that today two different 90-nm processes may not have the same
device or interconnect dimensions, and it may be that neither has any
important dimension that is actually 90-nm. The technology node has
become merely a name describing the order of manufacturing genera-
tions and the typical 30 percent scaling of dimensions. The important
historical trends in microprocessor fabrication demonstrated by Table 1-2
and quasi-ideal interconnect scaling are shown in Table 1-3.
Although it is going from one process generation to the next that
gradually moves the semiconductor industry forward, manufacturers do
not stand still for the 2 years between process generations. Small incre-
mental improvements are constantly being made to the process that
allow for part of the steady improvement in processor frequency. As a
result, a compaction microprocessor design may first ship at about the
TABLE 1-3 Microprocessor Fabrication Historical Trends
New generation every 2 years
35% reduction in gate length
30% reduction in gate oxide thickness
15% reduction in voltage
30% reduction in interconnect horizontal dimensions
15% reduction in interconnect vertical dimensions
Add 1 metal layer every other generation