
Page 137 - MODELING OF ASPHALT CONCRETE
P. 137
Complex Modulus Characterization of Asphalt Concr ete 115
The studied mixtures were from the FHWA-ALF, MnRoad and WesTrack
experimental test sites. The calibrated model coefficients for the studied mixtures were
k = −0.0124, k = −0.59063, k = 0.54011, and a = 1.395045, b = 0.464119, and g = −0.04893.
1 2 3
Both the bulk stress and octahedral shear stress had an effect on the modulus values as
the coefficients k and k indicate.
2 3
A separate verification of the model was conducted by testing a single specimen of
asphalt mixture with randomly varying confinement and deviatoric stress levels. The
difference between measured and predicted modulus values is less than a factor of 1.5
indicating relatively good prediction accuracy. It can be speculated that deviations
between predicted and measured values were caused by the damage accumulation
because applied stress states were in the dilative side of the phase change line most of
the time.
Stress-Dependent Stiffness Predictive Equation
Stiffness of asphalt mixture can be predicted using models such as the dynamic modulus
predictive equation (Andrei et al. 1999) and the Hirsch model (Christensen et al. 2003).
The advantage of these models is that they provide an approximate but useful way of
estimating mixture stiffness (modulus) for various design purposes. These models,
however, only model the modulus obtained in the linear viscoelastic region.
Furthermore, there are no simple models available to estimate the effect of nonlinearity
and confinement on HMA modulus values. Pellinen and Witczak (2002b) also
developed the stress-dependent stiffness predictive equation which is based on Eqs. (4-20)
and (4-21). Equations (4-22), (4-23), and (4-24) show the model form, and Eq. (4-25)
describes mix gradation (G ) as an average of the percent passing four sieve sizes of
a
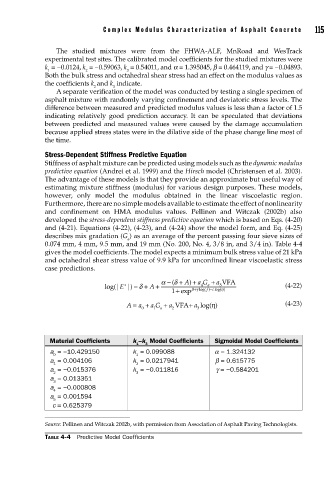
0.074 mm, 4 mm, 9.5 mm, and 19 mm (No. 200, No. 4, 3/8 in, and 3/4 in). Table 4-4
gives the model coefficients. The model expects a minimum bulk stress value of 21 kPa
and octahedral shear stress value of 9.9 kPa for unconfined linear viscoelastic stress
case predictions.
α − ( +δ A ) a G+ + a VFA
log(| |) =+δ A + βγ 4 a − 5 η (4-22)
∗
E
+
f
1 + exp log(() c log( )
A = a + a G + a VFA + a log( )η (4-23)
0 1 a 2 3
Material Coefficients k –k Model Coefficients Sigmoidal Model Coefficients
1 3
a = −10.429150 k = 0.099088 a = 1.324132
0 1
a = 0.004106 k = 0.0217941 b = 0.615775
1 2
a = −0.015376 k = −0.011816 g = −0.584201
2 3
a = 0.013351
3
a = −0.000808
4
a = 0.001594
5
c = 0.625379
Source: Pellinen and Witczak 2002b, with permission from Association of Asphalt Paving Technologists.
TABLE 4-4 Predictive Model Coefficients