
Page 86 - Book Hosokawa Nanoparticle Technology Handbook
P. 86
FUNDAMENTALS CH. 2 STRUCTURAL CONTROL OF NANOPARTICLES
500°C 400°C 300°C
30
Saturation curve
50
Supercritical state
40 20
Pressure (MPa) 30 Saturation curve Dielectric constant (−) 390°C
20
Critical point 10 Critical point 400°C
10 450°C
500°C
0
0
0 10 20 30 40
0 0.2 0.4 0.6 0.8 Pressure (MPa)
3
Density (g/cm )
Figure 2.2.10
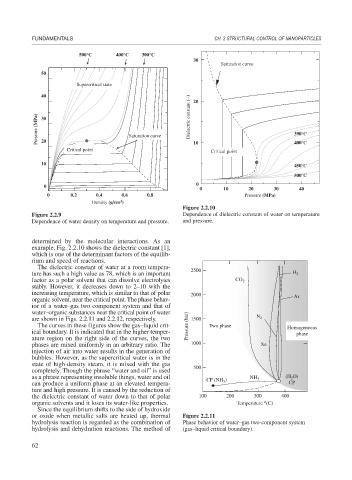
Figure 2.2.9 Dependence of dielectric constant of water on temperature
Dependence of water density on temperature and pressure. and pressure.
determined by the molecular interactions. As an
example, Fig. 2.2.10 shows the dielectric constant [1],
which is one of the determinant factors of the equilib-
rium and speed of reactions.
The dielectric constant of water at a room tempera-
ture has such a high value as 78, which is an important 2500 H 2
factor as a polar solvent that can dissolve electrolytes CO 2
stably. However, it decreases down to 2–10 with the
increasing temperature, which is similar to that of polar 2000 Ar
organic solvent, near the critical point. The phase behav-
ior of a water–gas two component system and that of
water–organic substances near the critical point of water
are shown in Figs. 2.2.11 and 2.2.12, respectively. 1500 N 2
The curves in these figures show the gas–liquid crit- Pressure (bar) Two phase Homogeneous
ical boundary. It is indicated that in the higher temper- phase
ature region on the right side of the curves, the two
phases are mixed uniformly in an arbitrary ratio. The 1000 Xe
injection of air into water results in the generation of
bubbles. However, as the supercritical water is in the
state of high-density steam, it is mixed with the gas 500
completely. Though the phrase “water and oil” is used
as a phrase representing insoluble things, water and oil CP (NH 3 ) NH 3 (H 2 O)
can produce a uniform phase at an elevated tempera- CP
ture and high pressure. It is caused by the reduction of
the dielectric constant of water down to that of polar 100 200 300 400
ο
organic solvents and it loses its water-like properties. Temperature (C)
Since the equilibrium shifts to the side of hydroxide
or oxide when metallic salts are heated up, thermal Figure 2.2.11
hydrolysis reaction is regarded as the combination of Phase behavior of water–gas two-component system
hydrolysis and dehydration reactions. The method of (gas–liquid critical boundary).
62