
Page 259 - Numerical Analysis Using MATLAB and Excel
P. 259
Chapter 6 Fourier, Taylor, and Maclaurin Series
i
iv()
0 v
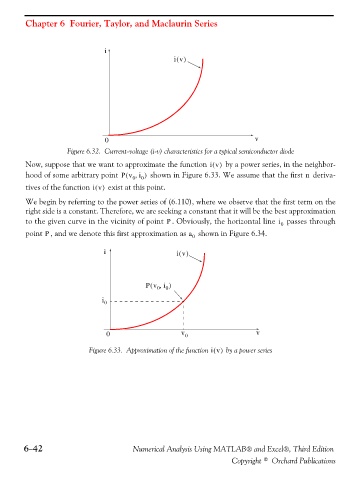
Figure 6.32. Current-voltage (i-v) characteristics for a typical semiconductor diode
Now, suppose that we want to approximate the function iv() by a power series, in the neighbor-
hood of some arbitrary point Pv i ) ( 0 , 0 shown in Figure 6.33. We assume that the first deriva-
n
tives of the function iv() exist at this point.
We begin by referring to the power series of (6.110), where we observe that the first term on the
right side is a constant. Therefore, we are seeking a constant that it will be the best approximation
to the given curve in the vicinity of point . Obviously, the horizontal line passes through
i
P
0
point , and we denote this first approximation as a 0 shown in Figure 6.34.
P
i iv()
Pv i,( 0 0 )
i 0
0 v 0 v
Figure 6.33. Approximation of the function iv() by a power series
6−42 Numerical Analysis Using MATLAB® and Excel®, Third Edition
Copyright © Orchard Publications