
Page 63 - Numerical Analysis Using MATLAB and Excel
P. 63
Chapter 2 Root Approximations
To plot fx() versus , we click on the Chart Wizard icon of the Standard Toolbar, and on the
x
Chart type column we click on XY (Scatter). From the displayed charts, we choose the one on top
of the right side (the smooth curves without connection points). Then, we click on Next, Next,
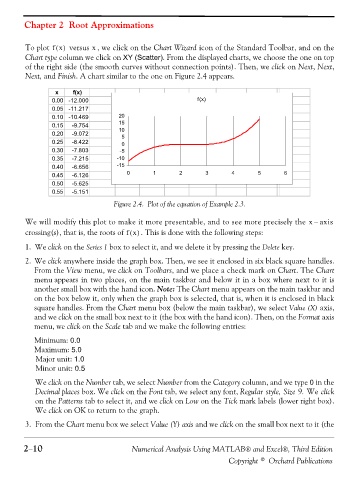
Next, and Finish. A chart similar to the one on Figure 2.4 appears.
x f(x)
0.00 -12.000 f(x)
0.05 -11.217
0.10 -10.469 20
0.15 -9.754 15
0.20 -9.072 10 5
0.25 -8.422 0
0.30 -7.803 -5
0.35 -7.215 -10
0.40 -6.656 -15
0.45 -6.126 0 1 2 3 4 5 6
0.50 -5.625
0.55 -5.151
Figure 2.4. Plot of the equation of Example 2.3.
We will modify this plot to make it more presentable, and to see more precisely the x – axis
crossing(s), that is, the roots of fx() . This is done with the following steps:
1. We click on the Series 1 box to select it, and we delete it by pressing the Delete key.
2. We click anywhere inside the graph box. Then, we see it enclosed in six black square handles.
From the View menu, we click on Toolbars, and we place a check mark on Chart. The Chart
menu appears in two places, on the main taskbar and below it in a box where next to it is
another small box with the hand icon. Note: The Chart menu appears on the main taskbar and
on the box below it, only when the graph box is selected, that is, when it is enclosed in black
square handles. From the Chart menu box (below the main taskbar), we select Value (X) axis,
and we click on the small box next to it (the box with the hand icon). Then, on the Format axis
menu, we click on the Scale tab and we make the following entries:
Minimum: 0.0
Maximum: 5.0
Major unit: 1.0
Minor unit: 0.5
We click on the Number tab, we select Number from the Category column, and we type 0 in the
Decimal places box. We click on the Font tab, we select any font, Regular style, Size 9. We click
on the Patterns tab to select it, and we click on Low on the Tick mark labels (lower right box).
We click on OK to return to the graph.
3. From the Chart menu box we select Value (Y) axis and we click on the small box next to it (the
2−10 Numerical Analysis Using MATLAB® and Excel®, Third Edition
Copyright © Orchard Publications