
Page 243 - Photonics Essentials an introduction with experiments
P. 243
Measurements in Photonics
Measurements in Photonics 237
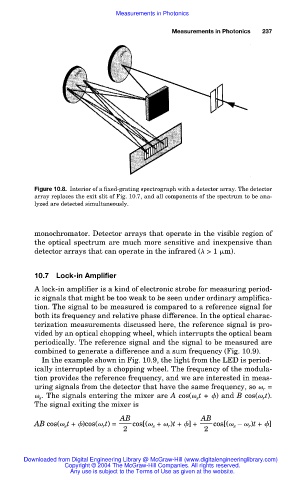
Figure 10.8. Interior of a fixed-grating spectrograph with a detector array. The detector
array replaces the exit slit of Fig. 10.7, and all components of the spectrum to be ana-
lyzed are detected simultaneously.
monochromator. Detector arrays that operate in the visible region of
the optical spectrum are much more sensitive and inexpensive than
detector arrays that can operate in the infrared ( > 1 m).
10.7 Lock-in Amplifier
A lock-in amplifier is a kind of electronic strobe for measuring period-
ic signals that might be too weak to be seen under ordinary amplifica-
tion. The signal to be measured is compared to a reference signal for
both its frequency and relative phase difference. In the optical charac-
terization measurements discussed here, the reference signal is pro-
vided by an optical chopping wheel, which interrupts the optical beam
periodically. The reference signal and the signal to be measured are
combined to generate a difference and a sum frequency (Fig. 10.9).
In the example shown in Fig. 10.9, the light from the LED is period-
ically interrupted by a chopping wheel. The frequency of the modula-
tion provides the reference frequency, and we are interested in meas-
uring signals from the detector that have the same frequency, so r =
s . The signals entering the mixer are A cos( s t + ) and B cos( r t).
The signal exiting the mixer is
AB AB
AB cos( s t + )cos( r t) = cos[( s + r )t + ] + cos[( s – r )t + ]
2 2
Downloaded from Digital Engineering Library @ McGraw-Hill (www.digitalengineeringlibrary.com)
Copyright © 2004 The McGraw-Hill Companies. All rights reserved.
Any use is subject to the Terms of Use as given at the website.