
Page 206 - Photoreactive Organic Thin Films
P. 206
6, PHOTOISOMEWZATION IN LANGMUIR-BLODGETT-KUHN STRUCTURES
H-aggregates Dimers Isolated J-aggregates
AX. = - 50 nm -1 5 to -25 nm 0 nm 1 5 to 25 nm
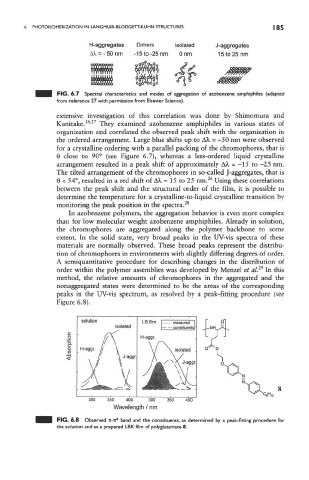
FIG. 6.7 Spectral characteristics and modes of aggregation of azobenzene amphiphiles (adapted
from reference 27 with permission from Elsevier Science).
extensive investigation of this correlation was done by Shimomura and
26 27
Kunitake. ' They examined azobenzene amphiphiles in various states of
organization and correlated the observed peak shift with the organization in
the ordered arrangement. Large blue shifts up to AX = -50 nm were observed
for a crystalline ordering with a parallel packing of the chromophores, that is
0 close to 90° (see Figure 6.7), whereas a less-ordered liquid crystalline
arrangement resulted in a peak shift of approximately AA, = -15 to -25 nm.
The tilted arrangement of the chromophores in so-called J-aggregates, that is
26
0 < 54°, resulted in a red shift of AA, = 15 to 25 nm. Using these correlations
between the peak shift and the structural order of the film, it is possible to
determine the temperature for a crystailine-to-liquid crystalline transition by
monitoring the peak position in the spectra. 28
In azobenzene polymers, the aggregation behavior is even more complex
than for low molecular weight azobenzene amphiphiles. Already in solution,
the chromophores are aggregated along the polymer backbone to some
extent. In the solid state, very broad peaks in the UV-vis spectra of these
materials are normally observed. These broad peaks represent the distribu-
tion of chromophores in environments with slightly differing degrees of order.
A semiquantitative procedure for describing changes in the distribution of
29
order within the polymer assemblies was developed by Menzel et al. In this
method, the relative amounts of chromophores in the aggregated and the
nonaggregated states were determined to be the areas of the corresponding
peaks in the UV-vis spectrum, as resolved by a peak-fitting procedure (see
Figure 6.8).
FIG. 6.8 Observed n-jc* band and the constituents, as determined by a peak-fitting procedure for
the solution and as a prepared LBK film of polyglutamate 8.