
Page 219 - Power Electronic Control in Electrical Systems
P. 219
//SYS21/F:/PEC/REVISES_10-11-01/075065126-CH006.3D ± 207 ± [177±262/86] 17.11.2001 10:23AM
Power electronic control in electrical systems 207
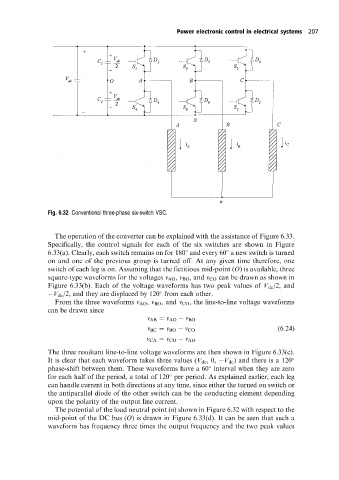
Fig. 6.32 Conventional three-phase six-switch VSC.
The operation of the converter can be explained with the assistance of Figure 6.33.
Specifically, the control signals for each of the six switches are shown in Figure
6.33(a). Clearly, each switch remains on for 180 and every 60 a new switch is turned
on and one of the previous group is turned off. At any given time therefore, one
switch of each leg is on. Assuming that the fictitious mid-point (O) is available, three
square-type waveforms for the voltages v AO , v BO ,and v CO can be drawn as shown in
Figure 6.33(b). Each of the voltage waveforms has two peak values of V dc /2, and
V dc /2, and they are displaced by 120 from each other.
From the three waveforms v AO , v BO , and v CO , the line-to-line voltage waveforms
can be drawn since
v AB v AO v BO
(6:24)
v BC v BO v CO
v CA v CO v AO
The three resultant line-to-line voltage waveforms are then shown in Figure 6.33(c).
It is clear that each waveform takes three values (V dc ,0, V dc ) and there is a 120
phase-shift between them. These waveforms have a 60 interval when they are zero
for each half of the period, a total of 120 per period. As explained earlier, each leg
can handle current in both directions at any time, since either the turned on switch or
the antiparallel diode of the other switch can be the conducting element depending
upon the polarity of the output line current.
The potential of the load neutral point (n) shown in Figure 6.32 with respect to the
mid-point of the DC bus (O) is drawn in Figure 6.33(d). It can be seen that such a
waveform has frequency three times the output frequency and the two peak values