
Page 184 - Practical Control Engineering a Guide for Engineers, Managers, and Practitioners
P. 184
An Underdamped Process 159
30
20
co 10
"'0 ...
~ 0
~::... -10
-20
-3010-3 1o2
100
~ 50
!IS
-a
~ ... 0
~::...
-50
-100
1o-3 100
Frequency (Hz)
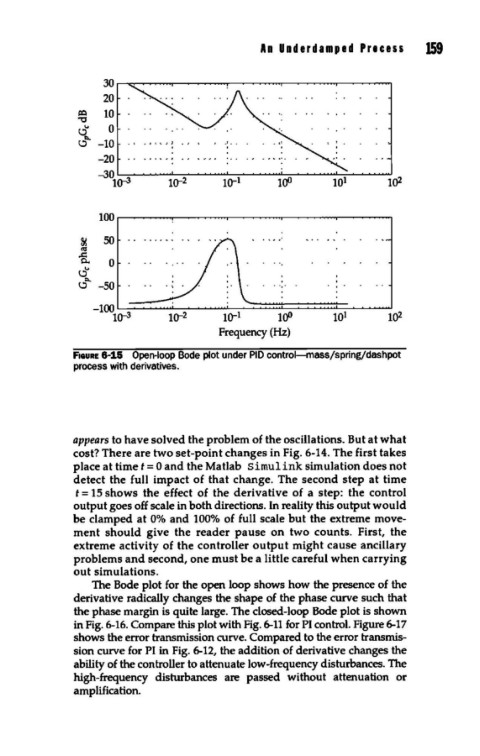
F1aURE 6-15 Open-loop Bode plot under PID control-mass/springfdashpot
process with derivatives.
appears to have solved the problem of the oscillations. But at what
cost? There are two set-point changes in Fig. 6-14. The first takes
place at timet= 0 and the Matlab simulink simulation does not
detect the full impact of that change. The second step at time
t = 15 shows the effect of the derivative of a step: the control
output goes off scale in both directions. In reality this output would
be clamped at 0% and 100% of full scale but the extreme move-
ment should give the reader pause on two counts. First, the
extreme activity of the controller output might cause ancillary
problems and second, one must be a little careful when carrying
out simulations.
The Bode plot for the open loop shows how the presence of the
derivative radically changes the shape of the phase curve such that
the phase margin is quite large. The closed-loop Bode plot is shown
in Fig. 6-16. Compare this plot with Fig. 6-11 for PI control. Figure 6-17
shows the error transmission curve. Compared to the error transmis-
sion curve for PI in Fig. 6-12, the addition of derivative changes the
ability of the controller to attenuate low-frequency disturbances. The
high-frequency disturbances are passed without attenuation or
amplification.