
Page 185 - Practical Control Engineering a Guide for Engineers, Managers, and Practitioners
P. 185
160 Chapter Six
~ 20~~~~~~~~~~~~~~~~~~~
!IS
-a 0
~ -20
r:.:J ... -40
.! -60
::::::-
~\,j -80 ............... .
r:.:;~-too~~~~~~~~~~~~~~~~~~~~~
to-3 1o-2 to-t 100 10 1 1o2
Frequency (Hz)
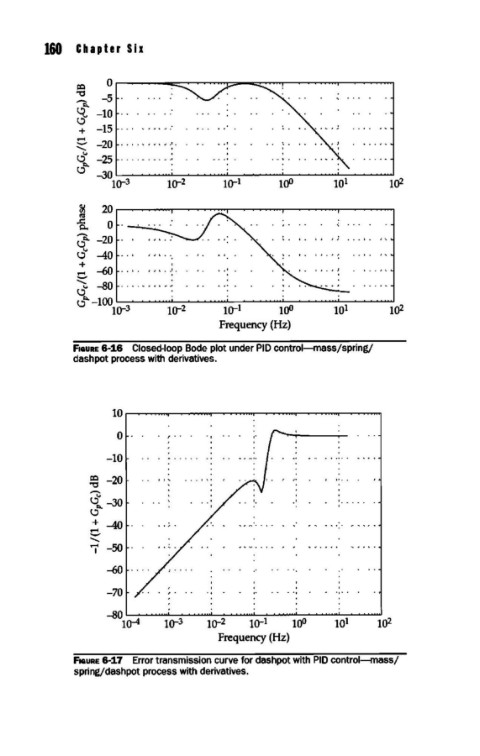
FIGURE 6-16 Closed-loop Bode plot under PID control-mass/spring/
dashpot process with derivatives.
10
0
-10
., -20
I:Q
-
r:.:J~ -30
r:.:J
,!-40 ,·
' -50
...-4
I
-60
-70
-BOlo-4 1Q-3 1Q-2 10r 1 100 1o2
Frequency (Hz)
FIGURE 6-17 Error transmission curve for dashpot with PID control-mass/
springfdashpot process with derivatives.