
Page 266 - Radar Technology Encyclopedia
P. 266
loss, radome loss, scanning 256
radomes are less than 1 dB (the average figure for L-band is The cumulative detection process is far less efficient than
0.2 dB and for S-band is 0.5 dB). DKB video integration, as shown in Fig. L28.
Ref.: Skolnik (1970), Ch.14. If video integration gives a detectability factor D (n) for
0
n hits in a single scan, and the cumulative process gives
Range cusping loss (see range straddling loss).
D cum (n,k), when the n hits are distributed over k scans, the
Range-gate matching loss is the equivalent of filter match- scan distribution loss can be calculated as
ing loss when a wideband IF receiver is used with range gates D cum k () )
Ln k ¤(
=
followed by narrowband filtering to form the correlator L nk ,( ) k--------------------------------------
d
D 1 () L n ()
i
0
equivalent of an approximately matched filter. For a rectangu-
where L (.) is the integration loss. For example, with n = 20,
lar pulse of width t passed through a gate of width tg, the loss i
k = 4, from Fig. L27 with P = 0.9, we find D (1) = 13 dB,
is d 0
D (4) = 11.2 dB. The integration loss is the difference
2 cum
¤
,
L = ( t t )t ³ t
m g g between the curve for coherent integration and that for video
integration, L (n/k) = L (5) = 1.0 dB, L (20) = 3.2 dB. With
2 i i i
L = ( tt )t £ t
,
¤
m g g k = 4 = 6 dB, the scan distribution loss is L (20,4) = 1.58 =
d
2.0dB. DKB
In general, the frequency response of the cascaded
Ref.: Barton (1988), pp. 31, 74.
receiver filter, H (f), and range gate is
1
sin pft g
Hf () H f () ------------------
=
1 pft
g
Thus, for H (f) approximately matched to the pulse spectrum,
1
a gate of any nonzero width causes a mismatch (too narrow a
system bandwidth). The optimum range gate following a
matched IF filter is a sampling impulse. DKB
Ref.: Barton (1969), p. 85.
Range straddling loss results from reception of signals not
centered in a range gate or on a sampling strobe. The loss is
defined as the increase in signal energy required to achieve a
given detection probability, for signals centered at random
points over the gate, relative to that for a centered signal. The
Figure L28 Comparison of detectability factors for different
loss may be minimized by using overlapping gates or strobes
methods of integration.
spaced at intervals less than the processed pulse width.
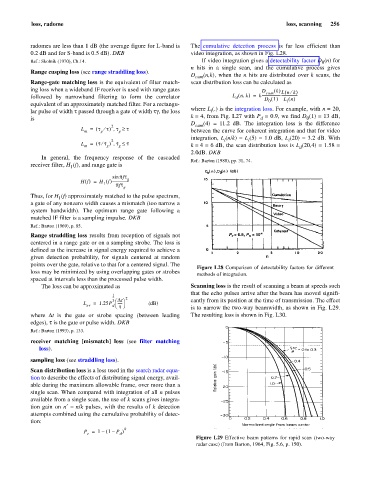
The loss can be approximated as Scanning loss is the result of scanning a beam at speeds such
that the echo pulses arrive after the beam has moved signifi-
1
--- 2
æ
3 Dt ö cantly from its position at the time of transmission. The effect
L = 1.25P ----- (dB)
er d è t ø is to narrow the two-way beamwidth, as shown in Fig. L29.
where Dt is the gate or strobe spacing (between leading The resulting loss is shown in Fig. L30.
edges), t is the gate or pulse width. DKB
Ref.: Barton (1993), p. 133.
receiver matching [mismatch] loss (see filter matching
loss).
sampling loss (see straddling loss).
Scan distribution loss is a loss used in the search radar equa-
tion to describe the effects of distributing signal energy, avail-
able during the maximum allowable frame, over more than a
single scan. When compared with integration of all n pulses
available from a single scan, the use of k scans gives integra-
/
n
k
tion gain on n¢ = pulses, with the results of k detection
attempts combined using the cumulative probability of detec-
tion:
k
–
P = 1 – ( 1 P )
c d
Figure L29 Effective beam patterns for rapid scan (two-way
radar case) (from Barton, 1964, Fig. 5.6, p. 150).