
Page 117 - Renewable Energy Devices and System with Simulations in MATLAB and ANSYS
P. 117
104 Renewable Energy Devices and Systems with Simulations in MATLAB and ANSYS ®
®
Start
Execute the P&O MPPT
algorithm with large
perturbation step
Execute the golden
section search MPPT
algorithm
Yes
Execute the InC MPPT
algorithm
No
Deviation from
the MPP, i.e.,
P pv / V pv >ε?
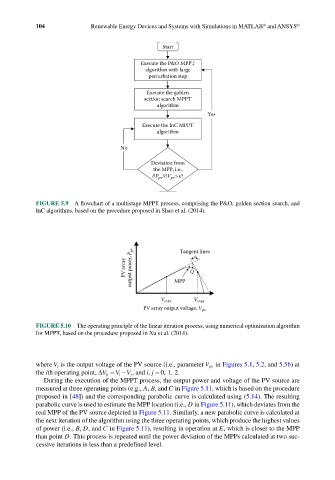
FIGURE 5.9 A flowchart of a multistage MPPT process, comprising the P&O, golden section search, and
InC algorithms, based on the procedure proposed in Shao et al. (2014).
output power, P pv MPP Q
PV array Tangent lines
V min V max
PV array output voltage, V pv
FIGURE 5.10 The operating principle of the linear iteration process, using numerical optimization algorithm
for MPPT, based on the procedure proposed in Xu et al. (2014).
where V i is the output voltage of the PV source (i.e., parameter V pv in Figures 5.1, 5.2, and 5.5b) at
the ith operating point, ∆V ij = V i − , and ij, = 012.
, ,
V j
During the execution of the MPPT process, the output power and voltage of the PV source are
measured at three operating points (e.g., A, B, and C in Figure 5.11, which is based on the procedure
proposed in [48]) and the corresponding parabolic curve is calculated using (5.14). The resulting
parabolic curve is used to estimate the MPP location (i.e., D in Figure 5.11), which deviates from the
real MPP of the PV source depicted in Figure 5.11. Similarly, a new parabolic curve is calculated at
the next iteration of the algorithm using the three operating points, which produce the highest values
of power (i.e., B, D, and C in Figure 5.11), resulting in operation at E, which is closer to the MPP
than point D. This process is repeated until the power deviation of the MPPs calculated at two suc-
cessive iterations is less than a predefined level.