
Page 118 - Renewable Energy Devices and System with Simulations in MATLAB and ANSYS
P. 118
Overview of PV Maximum Power Point Tracking Techniques 105
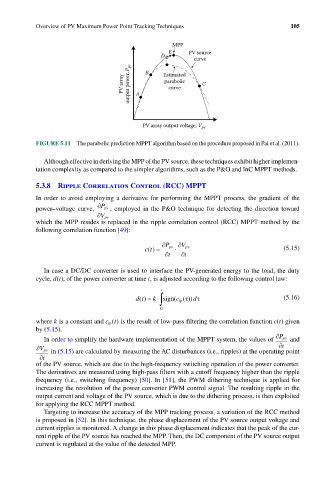
MPP
E PV source
D
curve
output power, P pv A curve
PV array B Estimated C
parabolic
PV array output voltage, V pv
FIGURE 5.11 The parabolic prediction MPPT algorithm based on the procedure proposed in Pai et al. (2011).
Although effective in deriving the MPP of the PV source, these techniques exhibit higher implemen-
tation complexity as compared to the simpler algorithms, such as the P&O and InC MPPT methods.
5.3.8 Ripple Correlation Control (RCC) MPPT
In order to avoid employing a derivative for performing the MPPT process, the gradient of the
power–voltage curve, ∂P pv , employed in the P&O technique for detecting the direction toward
∂V pv
which the MPP resides is replaced in the ripple correlation control (RCC) MPPT method by the
following correlation function [49]:
∂ P pv ∂
c t() = ⋅ V pv (5.15)
t ∂ t ∂
In case a DC/DC converter is used to interface the PV-generated energy to the load, the duty
cycle, d t(), of the power converter at time t, is adjusted according to the following control law:
t
∫
τ
k
(
d t() =⋅ sign( c lp )) dτ (5.16)
0
where k is a constant and c t() is the result of low-pass filtering the correlation function c t() given
lp
by (5.15).
In order to simplify the hardware implementation of the MPPT system, the values of ∂P pv and
∂t
in (5.15) are calculated by measuring the AC disturbances (i.e., ripples) at the operating point
∂V pv
∂t
of the PV source, which are due to the high-frequency switching operation of the power converter.
The derivatives are measured using high-pass filters with a cutoff frequency higher than the ripple
frequency (i.e., switching frequency) [50]. In [51], the PWM dithering technique is applied for
increasing the resolution of the power converter PWM control signal. The resulting ripple in the
output current and voltage of the PV source, which is due to the dithering process, is then exploited
for applying the RCC MPPT method.
Targeting to increase the accuracy of the MPP tracking process, a variation of the RCC method
is proposed in [52]. In this technique, the phase displacement of the PV source output voltage and
current ripples is monitored. A change in this phase displacement indicates that the peak of the cur-
rent ripple of the PV source has reached the MPP. Then, the DC component of the PV source output
current is regulated at the value of the detected MPP.