
Page 212 - Renewable Energy Devices and System with Simulations in MATLAB and ANSYS
P. 212
Power Electronics and Controls for Large Wind Turbines and Wind Farms 199
For use in
thermal model
U dq Third
s
× Duty Transformation harmonic Transformation
÷ Ratio D D abc D abc D dq dq
dq
V DC injection D s
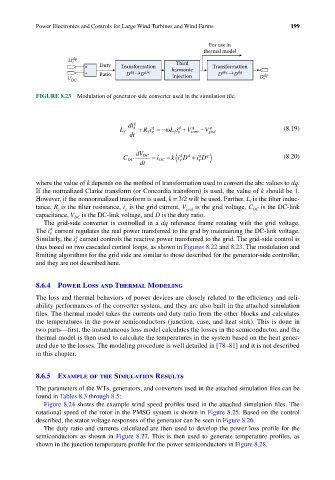
FIGURE 8.23 Modulation of generator-side converter used in the simulation file.
q
di g q d q q (8.19)
L f + Ri fg = −ω Li fg + V conv − V grid
dt
q
dV DC i DC − ( d d iD ) (8.20)
q
C DC = k iD + g
g
dt
where the value of k depends on the method of transformation used to convert the abc values to dq.
If the normalized Clarke transform (or Concordia transform) is used, the value of k should be 1.
However, if the nonnormalized transform is used, k = 3/2 will be used. Further, L is the filter induc-
f
tance, R is the filter resistance, i is the grid current, V grid is the grid voltage, C is the DC-link
DC
g
f
capacitance, V is the DC-link voltage, and D is the duty ratio.
DC
The grid-side converter is controlled in a dq reference frame rotating with the grid voltage.
d
The i g current regulates the real power transferred to the grid by maintaining the DC-link voltage.
q
Similarly, the i g current controls the reactive power transferred to the grid. The grid-side control is
thus based on two cascaded control loops, as shown in Figures 8.22 and 8.23. The modulation and
limiting algorithms for the grid side are similar to those described for the generator-side controller,
and they are not described here.
8.6.4 Power Loss and Thermal Modeling
The loss and thermal behaviors of power devices are closely related to the efficiency and reli-
ability performances of the converter system, and they are also built in the attached simulation
files. The thermal model takes the currents and duty ratio from the other blocks and calculates
the temperatures in the power semiconductors (junction, case, and heat sink). This is done in
two parts—first, the instantaneous loss model calculates the losses in the semiconductor, and the
thermal model is then used to calculate the temperatures in the system based on the heat gener-
ated due to the losses. The modeling procedure is well detailed in [78–81] and it is not described
in this chapter.
8.6.5 Example of the Simulation Results
The parameters of the WTs, generators, and converters used in the attached simulation files can be
found in Tables 8.3 through 8.5:
Figure 8.24 shows the example wind speed profiles used in the attached simulation files. The
rotational speed of the rotor in the PMSG system is shown in Figure 8.25. Based on the control
described, the stator voltage responses of the generator can be seen in Figure 8.26.
The duty ratio and currents calculated are then used to develop the power loss profile for the
semiconductors as shown in Figure 8.27. This is then used to generate temperature profiles, as
shown in the junction temperature profile for the power semiconductors in Figure 8.28.