Page 474 - Shigley's Mechanical Engineering Design
P. 474

bud29281_ch08_409-474.qxd  12/16/2009  7:11 pm  Page 449 pinnacle 203:MHDQ196:bud29281:0073529281:bud29281_pagefiles:


                                                                       Screws, Fasteners, and the Design of Nonpermanent Joints  449
                                               (b) Equation (8–30) gives the preload as

                                                           F i = 0.75F p = 0.75A t S p = 0.75(0.226)(85) = 14.4 kip
                                               where from Table 8–9, S p = 85 kpsi for an SAE grade 5 cap screw. Using Eq. (8–28),
                                               we obtain the load factor as the yielding factor of safety is


                                     Answer                     n p =  S p A t  =  85(0.226)  = 1.22
                                                                     CP + F i  0.280(5) + 14.4
                                               This is the traditional factor of safety, which compares the maximum bolt stress to the
                                               proof strength.
                                                  Using Eq. (8–29),

                                                                                85(0.226) − 14.4
                                                                    S p A t − F i
                                     Answer                    n L =         =                = 3.44
                                                                       CP          0.280(5)
                                               This factor is an indication of the overload on P that can be applied without exceeding
                                               the proof strength.
                                                  Next, using Eq. (8–30), we have

                                                                                    14.4
                                                                         F i
                                     Answer                      n 0 =         =            = 4.00
                                                                      P(1 − C)   5(1 − 0.280)
                                               If the force P gets too large, the joint will separate and the bolt will take the entire
                                               load. This factor guards against that event.
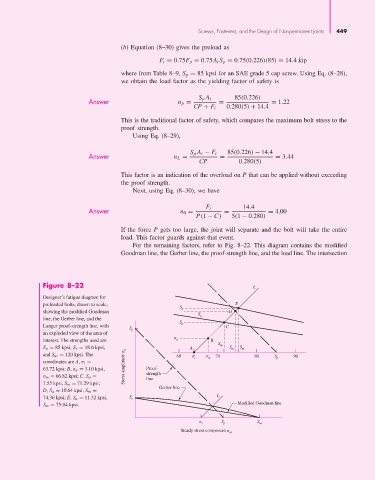
                                                  For the remaining factors, refer to Fig. 8–22. This diagram contains the modified
                                               Goodman line, the Gerber line, the proof-strength line, and the load line. The intersection


                       Figure 8–22                                                     L
                       Designer’s fatigue diagram for
                       preloaded bolts, drawn to scale,                           E
                                                                 S a
                       showing the modified Goodman                     S        D
                       line, the Gerber line, and the                  a
                                                                 S
                       Langer proof-strength line, with          a             C
                                                 S
                       an exploded view of the area of  p
                       interest. The strengths used are          a        B
                                                                             S
                       S p = 85 kpsi, S e = 18.6 kpsi,              A        m  S m  S m
                       and S ut = 120 kpsi. The                 60     i    m  70       80    S p   90
                       coordinates are A, σ i =
                       63.72 kpsi; B, σ a = 3.10 kpsi,  Stress amplitude   a  Proof-
                       σ m = 66.82 kpsi; C, S a =      strength
                                                       line
                       7.55 kpsi, S m = 71.29 kpsi;
                                                           Gerber line
                       D, S a = 10.64 kpsi, S m =
                       74.36 kpsi; E, S a = 11.32 kpsi,  S e                L
                       S m = 75.04 kpsi.                                           Modified Goodman line
                                                                              S          S
                                                                         i    p          ut
                                                                 Steady stress component
                                                                                m
   469   470   471   472   473   474   475   476   477   478   479