Page 475 - Shigley's Mechanical Engineering Design
P. 475

bud29281_ch08_409-474.qxd  12/18/09  2:52 PM  Page 450 epg Disk1:Desktop Folder:TEMPWORK:Don't-Delete Jobs:MHDQ196/Budynas:


                 450    Mechanical Engineering Design
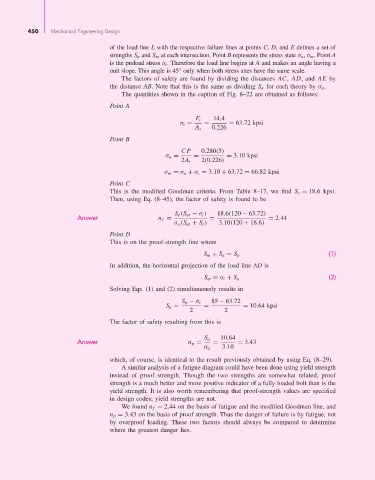
                                          of the load line L with the respective failure lines at points C, D, and E defines a set of
                                          strengths S a and S m at each intersection. Point B represents the stress state σ a, σ m . Point A
                                          is the preload stress σ i . Therefore the load line begins at A and makes an angle having a
                                          unit slope. This angle is 45° only when both stress axes have the same scale.
                                              The factors of safety are found by dividing the distances  AC,  AD, and  AE by
                                          the distance AB. Note that this is the same as dividing S a for each theory by σ a .
                                              The quantities shown in the caption of Fig. 8–22 are obtained as follows:
                                          Point A
                                                                          14.4
                                                                    F i
                                                                σ i =  =       = 63.72 kpsi
                                                                    A t  0.226
                                          Point B
                                                                CP    0.280(5)
                                                           σ a =    =         = 3.10 kpsi
                                                                2A t  2(0.226)
                                                           σ m = σ a + σ i = 3.10 + 63.72 = 66.82 kpsi

                                          Point C
                                          This is the modified Goodman criteria. From  Table 8–17, we find  S e = 18.6 kpsi.
                                          Then, using Eq. (8–45), the factor of safety is found to be
                                                              S e (S ut − σ i )  18.6(120 − 63.72)
                                Answer                   n f =           =                 = 2.44
                                                              σ a (S ut + S e )  3.10(120 + 18.6)
                                          Point D
                                          This is on the proof-strength line where
                                                                                                              (1)
                                                                       S m + S a = S p
                                          In addition, the horizontal projection of the load line AD is
                                                                                                              (2)
                                                                       S m = σ i + S a
                                          Solving Eqs. (1) and (2) simultaneously results in

                                                                S p − σ i  85 − 63.72
                                                           S a =       =           = 10.64 kpsi
                                                                   2         2
                                          The factor of safety resulting from this is


                                Answer                            n p =  S a  =  10.64  = 3.43
                                                                       σ a   3.10
                                          which, of course, is identical to the result previously obtained by using Eq. (8–29).
                                              A similar analysis of a fatigue diagram could have been done using yield strength
                                          instead of proof strength.  Though the two strengths are somewhat related, proof
                                          strength is a much better and more positive indicator of a fully loaded bolt than is the
                                          yield strength. It is also worth remembering that proof-strength values are specified
                                          in design codes; yield strengths are not.
                                              We found n f = 2.44 on the basis of fatigue and the modified Goodman line, and
                                          n p = 3.43 on the basis of proof strength. Thus the danger of failure is by fatigue, not
                                          by overproof loading.  These two factors should always be compared to determine
                                          where the greatest danger lies.
   470   471   472   473   474   475   476   477   478   479   480