
Page 51 - Statistics for Environmental Engineers
P. 51
L1592_Frame_C04 Page 43 Tuesday, December 18, 2001 1:41 PM
The Moving Average
Many standards for environmental quality have been written for an average of 30 consecutive days. The
language is something like the following: “Average daily values for 30 consecutive days shall not
exceed….” This is commonly interpreted to mean a monthly average, probably because dischargers
submit monthly reports to the regulatory agencies, but one should note the great difference between the
moving 30-day average and the monthly average as an effluent standard. There are only 12 monthly
averages in a year of the kind that start on the first day of a month, but there are a total of 365 moving
30-day averages that can be computed. One very bad day could make a monthly average exceed the
limit. This same single value is used to calculate 30 other moving averages and several of these might
exceed the limit. These two statistics — the strict monthly average and the 30-day moving average — have
different properties and imply different effects on the environment, although the effluent and the envi-
ronment are the same.
The length of time over which a moving average is calculated can be adjusted to represent the memory
of the environmental system as it responds to pollutants. This is done in ambient air pollution monitoring,
for example, where a short averaging time (one hour) is used for ozone.
The moving average is the simple average of the most recent k data points, that is, the sum of the
most recent k data divided by k:
i
y i k() = 1 ∑ y j i = k, k + 1,…, n
---
k
j=i−k+1
Thus, a seven-day moving average (MA7) uses the latest seven daily values, a ten-day average (MA10)
uses 10 points, and so on. Each data point is given equal weight in computing the average.
As each new observation is made, the summation will drop one term and add another term, giving
the simple updating formula:
y i k() = y i−1 k() + 1 1 ---y i−k = y i−1 k() + 1 y i−k )
--- y i –(
---y i –
k k k
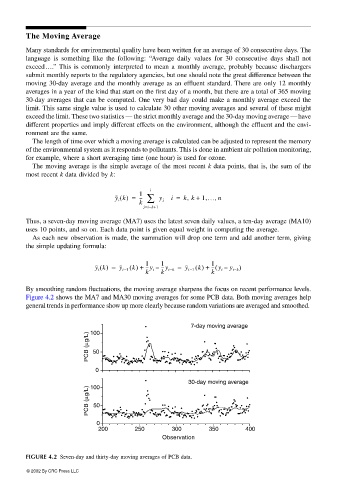
By smoothing random fluctuations, the moving average sharpens the focus on recent performance levels.
Figure 4.2 shows the MA7 and MA30 moving averages for some PCB data. Both moving averages help
general trends in performance show up more clearly because random variations are averaged and smoothed.
7-day moving average
100
PCB (µg/L) 50
0
30-day moving average
100
PCB (µg/L) 50
0
200 250 300 350 400
Observation
FIGURE 4.2 Seven-day and thirty-day moving averages of PCB data.
© 2002 By CRC Press LLC