
Page 48 - Statistics for Environmental Engineers
P. 48
L1592_frame_C03 Page 39 Tuesday, December 18, 2001 1:41 PM
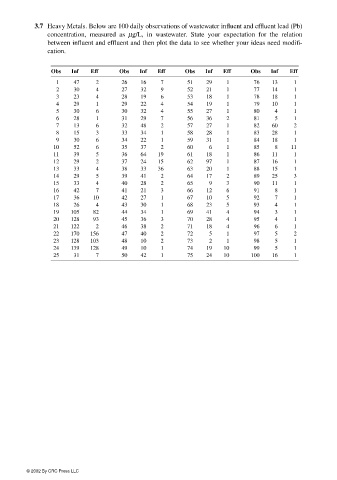
3.7 Heavy Metals. Below are 100 daily observations of wastewater influent and effluent lead (Pb)
concentration, measured as µg/L, in wastewater. State your expectation for the relation
between influent and effluent and then plot the data to see whether your ideas need modifi-
cation.
Obs Inf Eff Obs Inf Eff Obs Inf Eff Obs Inf Eff
1 47 2 26 16 7 51 29 1 76 13 1
2 30 4 27 32 9 52 21 1 77 14 1
3 23 4 28 19 6 53 18 1 78 18 1
4 29 1 29 22 4 54 19 1 79 10 1
5 30 6 30 32 4 55 27 1 80 4 1
6 28 1 31 29 7 56 36 2 81 5 1
7 13 6 32 48 2 57 27 1 82 60 2
8 15 3 33 34 1 58 28 1 83 28 1
9 30 6 34 22 1 59 31 1 84 18 1
10 52 6 35 37 2 60 6 1 85 8 11
11 39 5 36 64 19 61 18 1 86 11 1
12 29 2 37 24 15 62 97 1 87 16 1
13 33 4 38 33 36 63 20 1 88 15 1
14 29 5 39 41 2 64 17 2 89 25 3
15 33 4 40 28 2 65 9 3 90 11 1
16 42 7 41 21 3 66 12 6 91 8 1
17 36 10 42 27 1 67 10 5 92 7 1
18 26 4 43 30 1 68 23 5 93 4 1
19 105 82 44 34 1 69 41 4 94 3 1
20 128 93 45 36 3 70 28 4 95 4 1
21 122 2 46 38 2 71 18 4 96 6 1
22 170 156 47 40 2 72 5 1 97 5 2
23 128 103 48 10 2 73 2 1 98 5 1
24 139 128 49 10 1 74 19 10 99 5 1
25 31 7 50 42 1 75 24 10 100 16 1
© 2002 By CRC Press LLC