
Page 52 - Statistics for Environmental Engineers
P. 52
L1592_Frame_C04 Page 44 Tuesday, December 18, 2001 1:41 PM
The MA7, which is more reflective of short-term variations, has special appeal in being a weekly
average. Notice how the moving average lags behind the daily variation. The peak day is at 260, but the
MA7 peaks three to four days later (about k/2 days later). This does not diminish its value as a smoother,
but it does limit its value as a predictor. The longer the smoothing period (the larger k), the more the
average will lag behind the daily values.
The MA30 highlights long-term changes in performance. Notice the lack of response in the MA30
at day 255 when several high PCB concentrations occurred. The MA30 did not increase by very
much — only from 25 µg/L to about 40 µg/L — but it stayed at the 40 µg/L level for almost 30 days after
the elevated levels had disappeared. High concentrations of PCBs are not immediately harmful, but the
chemical does bioaccumulate in fish and other organisms and the long-term average is probably more
reflective of the environmental danger than the more responsive MA7.
Exponentially Weighted Moving Average
In the simple moving average, recent values and long-past values are weighted equally. For example,
the performance four weeks ago is reflected in an MA30 to the same degree as yesterday’s, although
the receiving environment may have “forgotten” the event of 4 weeks ago. The exponentially weighted
moving average (EWMA) weights the most recent event heavily, and each event going into the past
proportionately less.
The EWMA is calculated as:
∞
Z i = ( 1 φ) ∑ φ y i−j i = 1, 2,…
j
–
j=0
where φ is a suitably chosen constant between 0 and 1 that determines the length of the EWMA’s memory
and how much smoothing is done.
Why do we call the EWMA an average? Because it has the property that if all the observations are
increased by some fixed amount, then the EWMA is also increased by that same amount. The weights
must add up to one (unity) for this to happen. Obviously this is true for the weights of the equally
weighted average, as well as the EWMA.
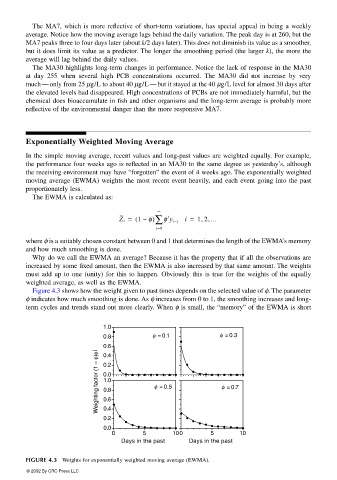
Figure 4.3 shows how the weight given to past times depends on the selected value of φ. The parameter
φ indicates how much smoothing is done. As φ increases from 0 to 1, the smoothing increases and long-
term cycles and trends stand out more clearly. When φ is small, the “memory” of the EWMA is short
1.0
0.8 φ = 0.1 φ = 0.3
0.6
Weighting factor (1 – φ)φ j 0.2 φ = 0.5 φ = 0.7
0.4
0.0
1.0
0.8
0.6
0.4
W
0.2
0.0
0 5 100 5 10
Days in the past Days in the past
FIGURE 4.3 Weights for exponentially weighted moving average (EWMA).
© 2002 By CRC Press LLC