
Page 53 - Statistics for Environmental Engineers
P. 53
L1592_Frame_C04 Page 45 Tuesday, December 18, 2001 1:41 PM
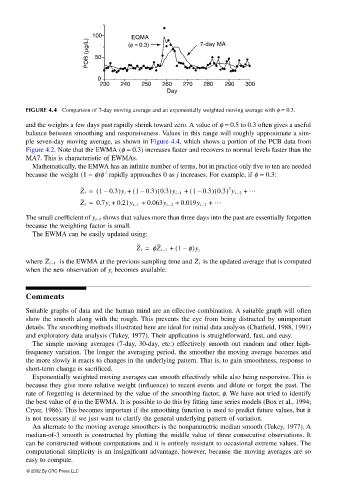
100 EQMA 7-day MA
POB (µg/L) 50 (φ = 0.3)
0
230 240 250 260 270 280 290 300
D Day
FIGURE 4.4 Comparison of 7-day moving average and an exponentially weighted moving average with φ = 0.3.
and the weights a few days past rapidly shrink toward zero. A value of φ = 0.5 to 0.3 often gives a useful
balance between smoothing and responsiveness. Values in this range will roughly approximate a sim-
ple seven-day moving average, as shown in Figure 4.4, which shows a portion of the PCB data from
Figure 4.2. Note that the EWMA (φ = 0.3) increases faster and recovers to normal levels faster than the
MA7. This is characteristic of EWMAs.
Mathematically, the EMWA has an infinite number of terms, but in practice only five to ten are needed
j
because the weight (1 − φ)φ rapidly approaches 0 as j increases. For example, if φ = 0.3:
(
(
Z i = ( 10.3)y i + ( 10.3) 0.3)y i 1– + ( 10.3) 0.3) y i 2– + …
2
–
–
–
Z i = 0.7y i + 0.21y i 1– + 0.063y i 2– + 0.019y i 3– + …
The small coefficient of y i−3 shows that values more than three days into the past are essentially forgotten
because the weighting factor is small.
The EWMA can be easily updated using:
Z i = φZ i 1– + ( 1 φ)y i
–
is the updated average that is computed
where Z i 1– is the EWMA at the previous sampling time and Z i
when the new observation of y i becomes available.
Comments
Suitable graphs of data and the human mind are an effective combination. A suitable graph will often
show the smooth along with the rough. This prevents the eye from being distracted by unimportant
details. The smoothing methods illustrated here are ideal for initial data analysis (Chatfield, 1988, 1991)
and exploratory data analysis (Tukey, 1977). Their application is straightforward, fast, and easy.
The simple moving averages (7-day, 30-day, etc.) effectively smooth out random and other high-
frequency variation. The longer the averaging period, the smoother the moving average becomes and
the more slowly it reacts to changes in the underlying pattern. That is, to gain smoothness, response to
short-term change is sacrificed.
Exponentially weighted moving averages can smooth effectively while also being responsive. This is
because they give more relative weight (influence) to recent events and dilute or forget the past. The
rate of forgetting is determined by the value of the smoothing factor, φ. We have not tried to identify
the best value of φ in the EWMA. It is possible to do this by fitting time series models (Box et al., 1994;
Cryer, 1986). This becomes important if the smoothing function is used to predict future values, but it
is not necessary if we just want to clarify the general underlying pattern of variation.
An alternate to the moving average smoothers is the nonparametric median smooth (Tukey, 1977). A
median-of-3 smooth is constructed by plotting the middle value of three consecutive observations. It
can be constructed without computations and it is entirely resistant to occasional extreme values. The
computational simplicity is an insignificant advantage, however, because the moving averages are so
easy to compute.
© 2002 By CRC Press LLC